San Fernando: Fire Incidents, California (CA)
Where are fire incidents reported in San Fernando, CA
Something went wrong! Please refresh the page.
|
| |||||||||||||||||||||||||||||||||||||||||||||||||||||||||||||||||||||||||||||||||||||||||||||||||||||||||||||
2005 - 2018 National Fire Incident Reporting System (NFIRS) incidents
- Incident types reported to NFIRS in San Fernando, CA
- 34542.3%Fire
- 15519.0%Hazardous Condition
- 14117.3%False Alarm
- 11514.1%Good Intent Call
- 435.3%Service Call
- 101.2%Rescue & EMS
- 60.7%Special Incident
- 10.1%Overpressure Rupture
- Fire incident types reported to NFIRS in San Fernando, CA
- 13539.1%Structure Fires
- 11633.6%Mobile Property/Vehicle Fires
- 8424.3%Outside Fires
- 102.9%Other
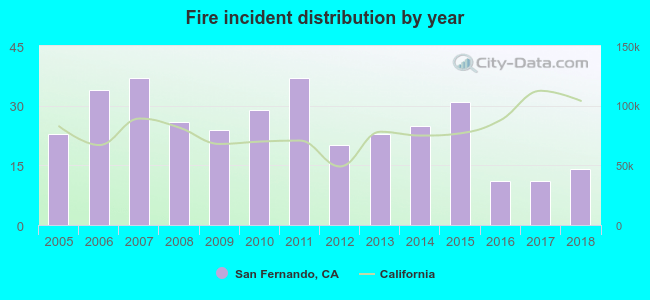 Based on the data from the years 2005 - 2018 the average number of fire incidents per year is 25. The highest number of fire incidents - 37 took place in 2007, and the least - 11 in 2016. The data has a dropping trend.
The average number of yearly fire incidents per 10k residents in San Fernando, CA compared to nearest cities:
(Note: Based on data for the last 3 years, including only cities with population 5,000 and above)
| San Fernando: | 4.9 |
| Burbank: | 18.2 |
| Santa Clarita: | 12.9 |
| Stevenson Ranch: | 6.6 |
| Newhall: | 0.1 |
| Glendale: | 9.1 |
| West Hollywood: | 25.5 |
| Los Angeles: | 16.6 |
| La Canada Flintridge: | 0.5 |

 Based on the data from the years 2005 - 2018 the average number of fire-related yearly casualties is 0. The highest number of reported casualties - 3 took place in 2009, and the lowest - 0 in 2006. The data has a dropping trend.
 38.0% incidents where reported in the morning and 62.0% in the evening. The most fires (15.4%) took place on Sunday, and the least (12.8%) on Monday.
 According to the 345 fire incidents from years 2005 - 2018 most fires (12.5%) took place during January, and the least (5.2%) in February.
 Out of all 816 cases reported during the years 2005 - 2018, the most belonged to the categories: Fire (42.3%), Hazardous Condition (19.0%), and False Alarm (17.3%).
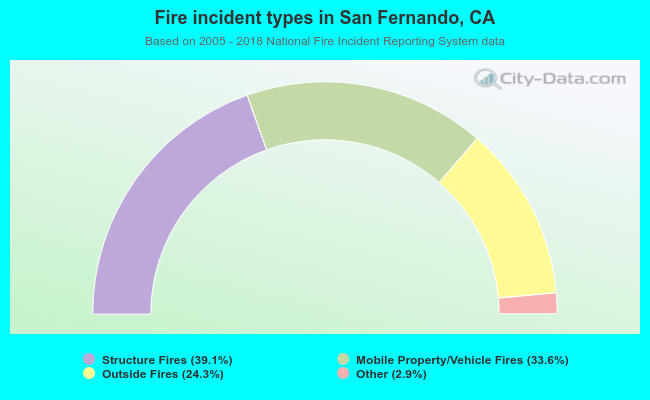 When looking into fire subcategories, the most reports belonged to: Structure Fires (39.1%), and Mobile Property/Vehicle Fires (33.6%).