Fairfield: Fire Incidents, Connecticut (CT)
Where are fire incidents reported in Fairfield, CT
Something went wrong! Please refresh the page.
| Fire incidents reported | |
|---|---|
| Sreet name | Count |
| POST RD | 234 |
| BLACK ROCK | 154 |
| BENSON RD | 140 |
| WARDE TER | 116 |
| KINGS HWY | 102 |
| FAIRFIELD BEACH RD | 94 |
| BLACK ROCK TNPK | 72 |
| KINGS HWY CUTOFF | 68 |
| MEADOWBROOK RD | 60 |
| ONE ROD HWY | 60 |
| STRATFIELD RD | 54 |
| UNQUOWA RD | 52 |
| MERRITT SB 44 TO 42 EXPY | 46 |
| REEF RD | 46 |
| CONGRESS ST | 42 |
| JENNINGS RD | 42 |
| COMMERCE DR | 38 |
| REDDING RD | 38 |
| TUNXIS HILL RD | 38 |
| BURR ST | 36 |
| MOREHOUSE HWY | 32 |
| ROUND HILL RD | 32 |
| JEFFERSON ST | 30 |
| MELVILLE AV | 30 |
| PARK AV | 30 |
| VILLA | 30 |
| BRONSON RD | 28 |
| FAIRFIELD WOODS RD | 28 |
| MILL PLAIN RD | 28 |
| PARK | 28 |
| Other | 946 |
2003 - 2018 National Fire Incident Reporting System (NFIRS) incidents
- Incident types reported to NFIRS in Fairfield, CT
- 19,19649.8%Rescue & EMS
- 4,95812.9%Service Call
- 4,95712.9%Hazardous Condition
- 4,44011.5%False Alarm
- 2,7747.2%Fire
- 1,9305.0%Good Intent Call
- 1500.4%Severe Weather
- 900.2%Special Incident
- 690.2%Overpressure Rupture
- Fire incident types reported to NFIRS in Fairfield, CT
- 1,32347.7%Structure Fires
- 92633.4%Outside Fires
- 49818.0%Mobile Property/Vehicle Fires
- 271.0%Other
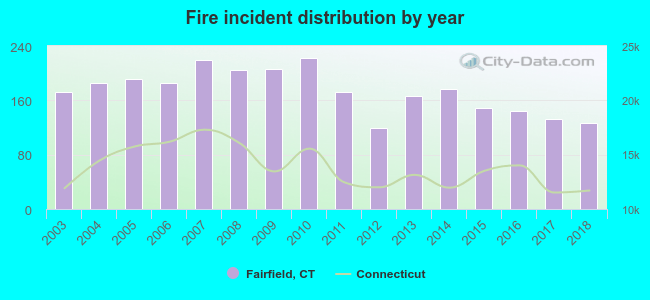 According to the data from the years 2003 - 2018 the average number of fire incidents per year is 173. The highest number of fires - 223 took place in 2010, and the least - 119 in 2012. The data has a dropping trend.
The average number of yearly fire incidents per 10k residents in Fairfield, CT compared to nearest cities:
(Note: Based on data for the last 3 years, including only cities with population 5,000 and above)
| Fairfield: | 22.6 |
| Bridgeport: | 30.2 |
| Westport: | 32.1 |
| Easton: | 34.3 |
| Trumbull: | 36.1 |
| Stratford: | 32.9 |
| Weston: | 20.6 |
| Norwalk: | 29.7 |
| Wilton: | 24.5 |
 The median response time based on all reported fire incidents is 6 minutes. This is similar to the Connecticut median value.
The median response time in Fairfield, CT compared to nearest cities:
(Note: Based on data for all years, including only cities with at least 500 fire incidents)
| Fairfield: | 6 minutes |
| Bridgeport: | 4 minutes |
| Westport: | 5 minutes |
| Trumbull: | 6 minutes |
| Stratford: | 5 minutes |
| Weston: | 6 minutes |
| Norwalk: | 6 minutes |
| Wilton: | 6 minutes |
| Milford: | 5 minutes |
 According to the data from the years 2003 - 2018 the average number of fire-related yearly deaths is 1. The highest number of deaths - 3 took place in 2012, and the lowest - 0 in 2003. The data has a constant trend.
The average number of deaths per 1,000 fires is 4. This indicator was the highest - 25 in 2012, and the lowest 0 in 2003. The trend for deaths per 1,000 fire incidents is constant. Compared to the Connecticut value the number of deaths per 1,000 fires is much higher.
According to the data from the years 2003 - 2018 the average number of fire-related yearly deaths is 1. The highest number of deaths - 3 took place in 2012, and the lowest - 0 in 2003. The data has a constant trend.
The average number of deaths per 1,000 fires is 4. This indicator was the highest - 25 in 2012, and the lowest 0 in 2003. The trend for deaths per 1,000 fire incidents is constant. Compared to the Connecticut value the number of deaths per 1,000 fires is much higher.Deaths per 1,000 incidents in Fairfield, CT compared to nearest cities:
(Note: Based on data for all years, including only cities with at least 2,500 fire incidents)
| Fairfield: | 4.0 |
| Bridgeport: | 2.5 |
| Stratford: | 2.7 |
| Norwalk: | 2.0 |
| Stamford: | 1.3 |
| West Haven: | 2.1 |
| Danbury: | 1.7 |
| New Haven: | 1.6 |
| Hamden: | 2.1 |
 According to the data from the years 2003 - 2018 the average number of fire-related casualties per year is 4. The highest number of reported casualties - 9 took place in 2005, and the lowest - 1 in 2010. The data has a decreasing trend.
The average number of injuries per 1,000 fires is 22. This indicator was the highest - 47 in 2005, and the lowest 4 in 2010. The trend for injuries per 1,000 incidents is declining. Compared to the Connecticut value the number of casualties per 1,000 fire incidents is higher.
According to the data from the years 2003 - 2018 the average number of fire-related casualties per year is 4. The highest number of reported casualties - 9 took place in 2005, and the lowest - 1 in 2010. The data has a decreasing trend.
The average number of injuries per 1,000 fires is 22. This indicator was the highest - 47 in 2005, and the lowest 4 in 2010. The trend for injuries per 1,000 incidents is declining. Compared to the Connecticut value the number of casualties per 1,000 fire incidents is higher.
 29.8% incidents where reported in the morning and 70.2% in the evening. The most fires (15.5%) took place on Saturday, and the least (13.0%) on Wednesday.
 Based on the 2,774 fire incidents from years 2003 - 2018 most fires (12.1%) took place during May, and the least (5.2%) in December.
 Out of all 38,564 cases reported during the years 2003 - 2018, the most belonged to the categories: Rescue & EMS (49.8%), Service Call (12.9%), and Hazardous Condition (12.9%).
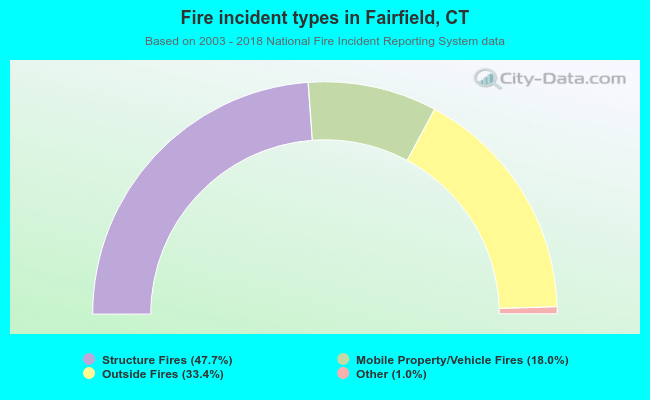 When looking into fire subcategories, the most incidents belonged to: Structure Fires (47.7%), and Outside Fires (33.4%).