Danbury: Fire Incidents, Connecticut (CT)
Where are fire incidents reported in Danbury, CT
Something went wrong! Please refresh the page.
| Fire incidents reported | |
|---|---|
| Sreet name | Count |
| MAIN ST | 242 |
| INTERSTATE 84 | 184 |
| NEWTOWN RD | 172 |
| PADANARAM RD | 136 |
| BACKUS AVE | 132 |
| FEDERAL RD | 126 |
| MILL PLAIN RD | 98 |
| WHITE ST | 94 |
| SOUTH ST | 84 |
| PEMBROKE RD | 68 |
| TRIANGLE ST | 64 |
| HOSPITAL AVE | 62 |
| KING ST | 58 |
| LIBERTY ST | 58 |
| CLAPBOARD RIDGE RD | 56 |
| WOOSTER ST | 56 |
| OSBORNE ST | 54 |
| ELM ST | 50 |
| PARK AVE | 50 |
| PLUMTREES RD | 48 |
| SUGAR HOLLOW RD | 48 |
| SHELTER ROCK RD | 46 |
| MEMORIAL DR | 44 |
| COAL PIT HILL RD | 40 |
| GREAT PLAIN RD | 40 |
| SCUPPO RD | 40 |
| BALMFORTH AVE | 36 |
| TOWN HILL AVE | 36 |
| HAYESTOWN RD | 32 |
| LAKE AVE | 30 |
| Other | 579 |
2002 - 2018 National Fire Incident Reporting System (NFIRS) incidents
- Incident types reported to NFIRS in Danbury, CT
- 22,08546.8%Rescue & EMS
- 6,73514.3%Service Call
- 6,52513.8%Hazardous Condition
- 4,4709.5%Good Intent Call
- 4,4009.3%False Alarm
- 2,8636.1%Fire
- 810.2%Overpressure Rupture
- Fire incident types reported to NFIRS in Danbury, CT
- 1,11038.8%Outside Fires
- 1,07137.4%Structure Fires
- 57019.9%Mobile Property/Vehicle Fires
- 1123.9%Other
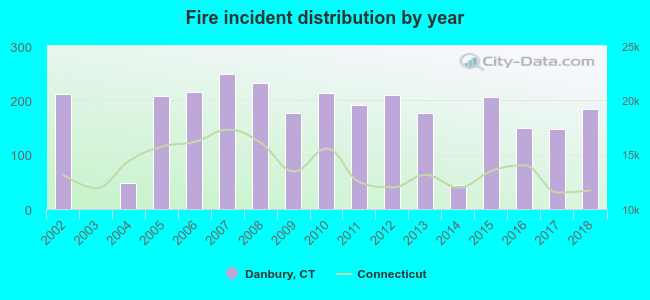 Based on the data from the years 2002 - 2018 the average number of fires per year is 168. The highest number of fires - 249 took place in 2007, and the least - 0 in 2003. The data has a decreasing trend.
The average number of yearly fire incidents per 10k residents in Danbury, CT compared to nearest cities:
(Note: Based on data for the last 3 years, including only cities with population 5,000 and above)
| Danbury: | 19.2 |
| Bethel: | 73.3 |
| New Fairfield: | 15.6 |
| Brookfield: | 22.3 |
| Redding: | 19.3 |
| Ridgefield: | 34.0 |
| New Milford: | 70.0 |
| Southbury: | 30.6 |
| Monroe: | 45.5 |
 The median response time based on all reported fire incidents is 5 minutes. This is similar to the Connecticut median value.
The median response time in Danbury, CT compared to nearest cities:
(Note: Based on data for all years, including only cities with at least 500 fire incidents)
| Danbury: | 5 minutes |
| Bethel: | 6 minutes |
| New Fairfield: | 7 minutes |
| Brookfield: | 6 minutes |
| Redding: | 7 minutes |
| Newtown: | 7 minutes |
| Ridgefield: | 6 minutes |
| New Milford: | 7 minutes |
| Southbury: | 5 minutes |
 Based on the data from the years 2002 - 2018 the average number of fire-related fatalities per year is 0. The highest number of deaths - 2 took place in 2005, and the lowest - 0 in 2002. The data has a constant trend.
The average number of deaths per 1,000 fire incidents is 1. This indicator was the highest - 10 in 2005, and the lowest 0 in 2002. The trend for deaths per 1,000 incidents is constant. Compared to the Connecticut value the number of fatalities per 1,000 incidents is similar.
Based on the data from the years 2002 - 2018 the average number of fire-related fatalities per year is 0. The highest number of deaths - 2 took place in 2005, and the lowest - 0 in 2002. The data has a constant trend.
The average number of deaths per 1,000 fire incidents is 1. This indicator was the highest - 10 in 2005, and the lowest 0 in 2002. The trend for deaths per 1,000 incidents is constant. Compared to the Connecticut value the number of fatalities per 1,000 incidents is similar.Deaths per 1,000 incidents in Danbury, CT compared to nearest cities:
(Note: Based on data for all years, including only cities with at least 2,500 fire incidents)
| Danbury: | 1.7 |
| Fairfield: | 4.0 |
| Bridgeport: | 2.5 |
| Norwalk: | 2.0 |
| Stratford: | 2.7 |
 According to the reports from the years 2002 - 2018 the average number of fire-related casualties per year is 3. The highest number of casualties - 8 took place in 2007, and the lowest - 0 in 2002. The data has a rising trend.
The average number of injuries per 1,000 fires is 18. This indicator was the highest - 43 in 2018, and the lowest 0 in 2002. The trend for injuries per 1,000 incidents is rising. Compared to the state value the number of injuries per 1,000 fire incidents is higher.
According to the reports from the years 2002 - 2018 the average number of fire-related casualties per year is 3. The highest number of casualties - 8 took place in 2007, and the lowest - 0 in 2002. The data has a rising trend.
The average number of injuries per 1,000 fires is 18. This indicator was the highest - 43 in 2018, and the lowest 0 in 2002. The trend for injuries per 1,000 incidents is rising. Compared to the state value the number of injuries per 1,000 fire incidents is higher.Casualties per 1,000 incidents in Danbury, CT compared to nearest cities:
(Note: Based on data for all years, including only cities with at least 500 fire incidents)
| Danbury: | 20.3 |
| Bethel: | 10.8 |
| New Fairfield: | 14.3 |
| Brookfield: | 5.9 |
| Redding: | 9.8 |
| Newtown: | 11.1 |
| Ridgefield: | 6.7 |
| New Milford: | 29.4 |
| Southbury: | 4.1 |
 29.2% incidents where reported in the morning and 70.8% in the evening. The most fires (15.4%) took place on Saturday, and the least (12.7%) on Tuesday.
 Based on the 2,863 fire incident reports from years 2002 - 2018 most fires (12.0%) took place during April, and the least (6.1%) in February.
 Out of all 47,237 cases reported during the years 2002 - 2018, the most belonged to the categories: Rescue & EMS (46.8%), Service Call (14.3%), and Hazardous Condition (13.8%).
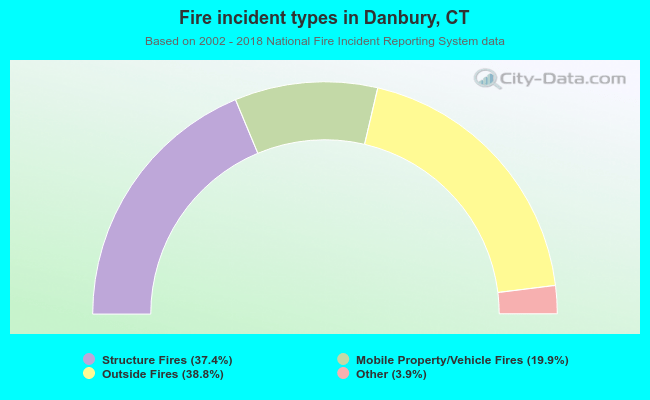 When looking into fire subcategories, the most reports belonged to: Outside Fires (38.8%), and Structure Fires (37.4%).