Norwalk: Fire Incidents, Connecticut (CT)
Where are fire incidents reported in Norwalk, CT
Something went wrong! Please refresh the page.
| Fire incidents reported | |
|---|---|
| Sreet name | Count |
| MAIN ST | 282 |
| CEDAR ST | 210 |
| CONNECTICUT AV | 200 |
| MEADOW ST | 140 |
| MAIN AV | 128 |
| WARD ST | 126 |
| ELY AV | 118 |
| FLAX HILL RD | 114 |
| WESTPORT AV | 102 |
| CONNECTICUT AVE | 100 |
| MAIN AVE | 96 |
| WATER ST | 94 |
| MONROE ST | 90 |
| WEST AVE | 84 |
| EAST AV | 82 |
| WASHINGTON ST | 76 |
| RICHARDS AVE | 72 |
| MAIN | 64 |
| WEST AV | 64 |
| INTERSTATE 95 | 62 |
| ELY AVE | 58 |
| SUNCREST RD | 58 |
| RICHARDS AV | 56 |
| EMERSON ST | 54 |
| WESTPORT AVE | 54 |
| MAPLE ST | 52 |
| TAYLOR AV | 52 |
| CHESTNUT ST | 48 |
| PROSPECT ST | 48 |
| ROCKS RD | 44 |
| Other | 1,627 |
2003 - 2018 National Fire Incident Reporting System (NFIRS) incidents
- Incident types reported to NFIRS in Norwalk, CT
- 16,99644.9%Rescue & EMS
- 6,43817.0%Hazardous Condition
- 5,82115.4%False Alarm
- 4,45511.8%Fire
- 2,0115.3%Service Call
- 1,9445.1%Good Intent Call
- 890.2%Overpressure Rupture
- 790.2%Special Incident
- Fire incident types reported to NFIRS in Norwalk, CT
- 2,14548.1%Structure Fires
- 1,44032.3%Outside Fires
- 70415.8%Mobile Property/Vehicle Fires
- 1663.7%Other
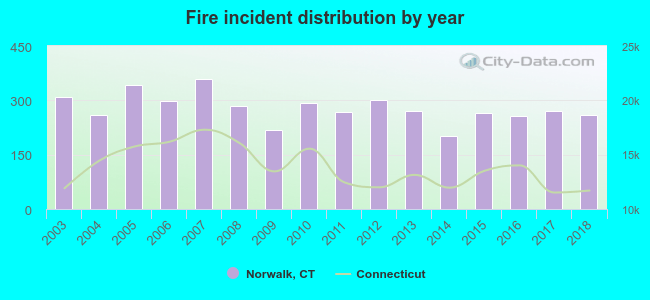 Based on the data from the years 2003 - 2018 the average number of fire incidents per year is 278. The highest number of fire incidents - 359 took place in 2007, and the least - 202 in 2014. The data has a decreasing trend.
The average number of yearly fire incidents per 10k residents in Norwalk, CT compared to nearest cities:
(Note: Based on data for the last 3 years, including only cities with population 5,000 and above)
| Norwalk: | 29.7 |
| Darien: | 23.6 |
| Westport: | 32.1 |
| New Canaan: | 22.5 |
| Wilton: | 24.5 |
| Stamford: | 24.3 |
| Weston: | 20.6 |
| Fairfield: | 22.6 |
| Old Greenwich: | 4.0 |
 The median response time based on all reported fire incidents is 6 minutes. This is about the same as the state median value.
The median response time in Norwalk, CT compared to nearest cities:
(Note: Based on data for all years, including only cities with at least 500 fire incidents)
| Norwalk: | 6 minutes |
| Darien: | 7 minutes |
| Westport: | 5 minutes |
| New Canaan: | 6 minutes |
| Wilton: | 6 minutes |
| Stamford: | 4 minutes |
| Weston: | 6 minutes |
| Fairfield: | 6 minutes |
| Greenwich: | 5 minutes |
 According to the reports from the years 2003 - 2018 the average number of fire-related fatalities per year is 1. The highest number of reported deaths - 2 took place in 2008, and the lowest - 0 in 2003. The data has a constant trend.
The average number of fatalities per 1,000 fire incidents is 2. This indicator was the highest - 9 in 2009, and the lowest 0 in 2003. The trend for deaths per 1,000 fires is constant. Compared to the state value the number of deaths per 1,000 fire incidents is higher.
According to the reports from the years 2003 - 2018 the average number of fire-related fatalities per year is 1. The highest number of reported deaths - 2 took place in 2008, and the lowest - 0 in 2003. The data has a constant trend.
The average number of fatalities per 1,000 fire incidents is 2. This indicator was the highest - 9 in 2009, and the lowest 0 in 2003. The trend for deaths per 1,000 fires is constant. Compared to the state value the number of deaths per 1,000 fire incidents is higher.Deaths per 1,000 incidents in Norwalk, CT compared to nearest cities:
(Note: Based on data for all years, including only cities with at least 2,500 fire incidents)
| Norwalk: | 2.0 |
| Stamford: | 1.3 |
| Fairfield: | 4.0 |
| Bridgeport: | 2.5 |
| Stratford: | 2.7 |
 According to the data from the years 2003 - 2018 the average number of fire-related casualties per year is 2. The highest number of injuries - 6 took place in 2012, and the lowest - 0 in 2003. The data has an increasing trend.
The average number of casualties per 1,000 fires is 7. This indicator was the highest - 20 in 2012, and the lowest 0 in 2003. The trend for casualties per 1,000 fire incidents is growing. Compared to the Connecticut value the number of casualties per 1,000 fires is lower.
According to the data from the years 2003 - 2018 the average number of fire-related casualties per year is 2. The highest number of injuries - 6 took place in 2012, and the lowest - 0 in 2003. The data has an increasing trend.
The average number of casualties per 1,000 fires is 7. This indicator was the highest - 20 in 2012, and the lowest 0 in 2003. The trend for casualties per 1,000 fire incidents is growing. Compared to the Connecticut value the number of casualties per 1,000 fires is lower.
 29.8% incidents where reported in the morning and 70.2% in the evening. The most fires (15.6%) took place on Saturday, and the least (13.1%) on Tuesday.
 Based on the 4,455 fire incident reports from years 2003 - 2018 most fires (10.1%) took place during April, and the least (6.7%) in December.
 Out of all 37,858 cases reported during the years 2003 - 2018, the most belonged to the categories: Rescue & EMS (44.9%), Hazardous Condition (17.0%), and False Alarm (15.4%).
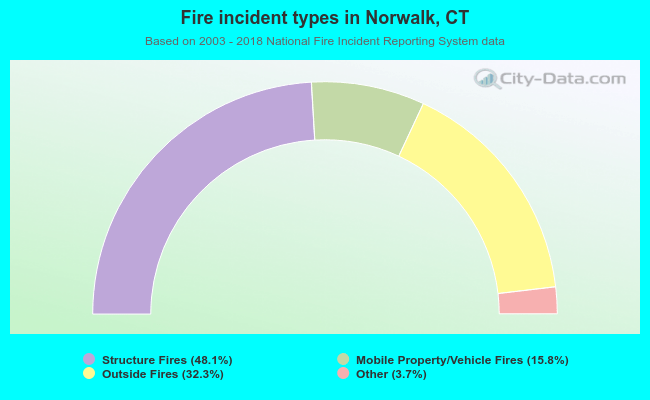 When looking into fire subcategories, the most reports belonged to: Structure Fires (48.1%), and Outside Fires (32.3%).