Wilton: Fire Incidents, Connecticut (CT)
Where are fire incidents reported in Wilton, CT
Something went wrong! Please refresh the page.
| Fire incidents reported | |
|---|---|
| Sreet name | Count |
| DANBURY RD | 192 |
| RIVER RD | 52 |
| RIDGEFIELD RD | 48 |
| BELDEN HILL RD | 30 |
| OLD RIDGEFIELD RD | 28 |
| RANGE RD | 24 |
| THUNDER LAKE RD | 22 |
| WESTPORT RD | 22 |
| NOD HILL RD | 20 |
| HURLBUTT ST | 18 |
| DRUM HILL RD | 16 |
| STURGES RIDGE RD | 16 |
| WOLFPIT RD | 16 |
| CHESTNUT HILL RD | 14 |
| PIMPEWAUG RD | 14 |
| SHARP HILL RD | 14 |
| GRUMMAN HILL RD | 12 |
| LINDEN TREE RD | 12 |
| MOUNTAIN. RD | 12 |
| NEW CANAAN RD | 12 |
| OLD KINGDOM RD | 12 |
| CANNON RD | 10 |
| MATHER ST | 10 |
| MIDDLEBROOK FARM RD | 10 |
| THAYER POND RD | 10 |
| BALD HILL RD | 8 |
| BRIARDALE PL | 8 |
| CHICKEN ST | 8 |
| GODFREY PL | 8 |
| HONEY HILL RD | 8 |
| Other | 50 |
2002 - 2018 National Fire Incident Reporting System (NFIRS) incidents
- Incident types reported to NFIRS in Wilton, CT
- 4,81443.4%Rescue & EMS
- 1,87816.9%Hazardous Condition
- 1,81016.3%False Alarm
- 9938.9%Good Intent Call
- 8237.4%Service Call
- 7366.6%Fire
- 260.2%Overpressure Rupture
- 140.1%Special Incident
- Fire incident types reported to NFIRS in Wilton, CT
- 40855.4%Structure Fires
- 19326.2%Outside Fires
- 9112.4%Mobile Property/Vehicle Fires
- 446.0%Other
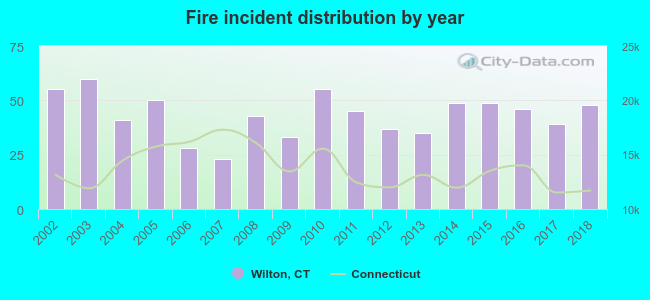 Based on the data from the years 2002 - 2018 the average number of fires per year is 43. The highest number of fires - 60 took place in 2003, and the least - 23 in 2007. The data has a declining trend.
The average number of yearly fire incidents per 10k residents in Wilton, CT compared to nearest cities:
(Note: Based on data for the last 3 years, including only cities with population 5,000 and above)
| Wilton: | 24.5 |
| Weston: | 20.6 |
| New Canaan: | 22.5 |
| Ridgefield: | 34.0 |
| Westport: | 32.1 |
| Norwalk: | 29.7 |
| Redding: | 19.3 |
| Easton: | 34.3 |
| Darien: | 23.6 |
 The median response time based on all reported fire incidents is 6 minutes. This is similar to the Connecticut median value.
The median response time in Wilton, CT compared to nearest cities:
(Note: Based on data for all years, including only cities with at least 500 fire incidents)
| Wilton: | 6 minutes |
| Weston: | 6 minutes |
| New Canaan: | 6 minutes |
| Ridgefield: | 6 minutes |
| Westport: | 5 minutes |
| Norwalk: | 6 minutes |
| Redding: | 7 minutes |
| Darien: | 7 minutes |
| Fairfield: | 6 minutes |
 32.1% incidents where reported in the morning and 67.9% in the evening. The most fires (15.6%) took place on Sunday, and the least (12.6%) on Thursday.
 According to the 736 fire incident reports from years 2002 - 2018 most fires (11.1%) took place during January, and the least (5.0%) in September.
 Out of all 11,100 cases reported during the years 2002 - 2018, the most belonged to the categories: Rescue & EMS (43.4%), Hazardous Condition (16.9%), and False Alarm (16.3%).
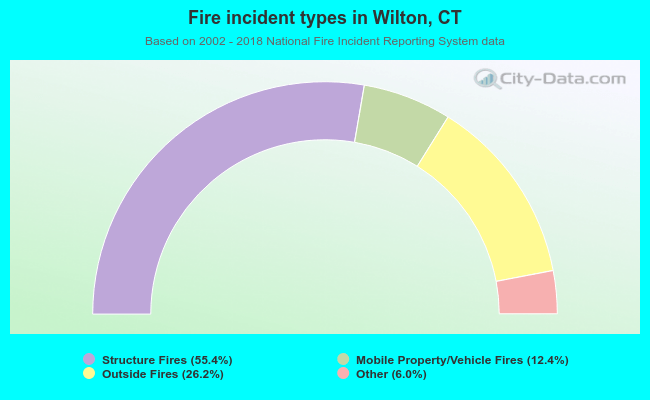 When looking into fire subcategories, the most reports belonged to: Structure Fires (55.4%), and Outside Fires (26.2%).