Weston: Fire Incidents, Connecticut (CT)
Where are fire incidents reported in Weston, CT
Something went wrong! Please refresh the page.
|
| |||||||||||||||||||||||||||||||||||||||||||||||||||||||||||||||||||||||||||||||||||||||||||||||||||||||||||||
2002 - 2018 National Fire Incident Reporting System (NFIRS) incidents
- Incident types reported to NFIRS in Weston, CT
- 1,33628.8%False Alarm
- 1,14624.7%Hazardous Condition
- 97621.0%Rescue & EMS
- 55512.0%Fire
- 3206.9%Good Intent Call
- 2725.9%Service Call
- 310.7%Severe Weather
- Fire incident types reported to NFIRS in Weston, CT
- 34562.2%Structure Fires
- 14726.5%Outside Fires
- 407.2%Mobile Property/Vehicle Fires
- 234.1%Other
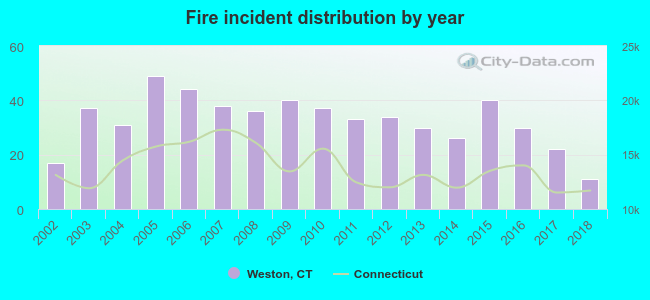 Based on the data from the years 2002 - 2018 the average number of fire incidents per year is 33. The highest number of fire incidents - 49 took place in 2005, and the least - 11 in 2018. The data has a declining trend.
The average number of yearly fire incidents per 10k residents in Weston, CT compared to nearest cities:
(Note: Based on data for the last 3 years, including only cities with population 5,000 and above)
| Weston: | 20.6 |
| Wilton: | 24.5 |
| Easton: | 34.3 |
| Westport: | 32.1 |
| Redding: | 19.3 |
| Fairfield: | 22.6 |
| Ridgefield: | 34.0 |
| New Canaan: | 22.5 |
| Norwalk: | 29.7 |
 The median response time based on all reported fire incidents is 6 minutes. This is close to the state median value.
The median response time in Weston, CT compared to nearest cities:
(Note: Based on data for all years, including only cities with at least 500 fire incidents)
| Weston: | 6 minutes |
| Wilton: | 6 minutes |
| Westport: | 5 minutes |
| Redding: | 7 minutes |
| Fairfield: | 6 minutes |
| Ridgefield: | 6 minutes |
| New Canaan: | 6 minutes |
| Norwalk: | 6 minutes |
| Trumbull: | 6 minutes |
 31.5% incidents where reported in the morning and 68.5% in the evening. The most fires (15.5%) took place on Thursday, and the least (12.1%) on Tuesday.
 Based on the 555 incident reports from years 2002 - 2018 most fires (12.4%) took place during March, and the least (5.6%) in August.
 Out of all 4,642 cases reported during the years 2002 - 2018, the most belonged to the categories: False Alarm (28.8%), Hazardous Condition (24.7%), and Rescue & EMS (21.0%).
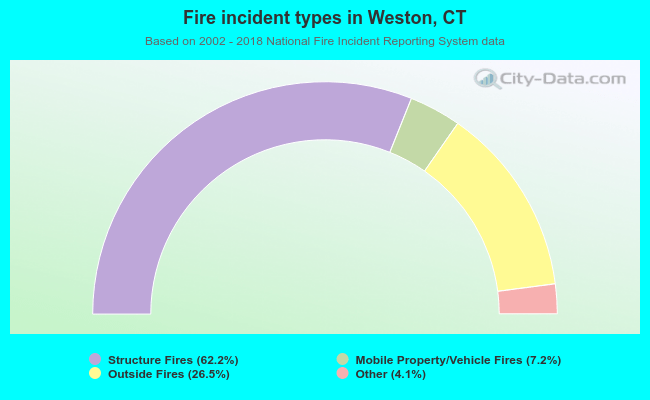 When looking into fire subcategories, the most incidents belonged to: Structure Fires (62.2%), and Outside Fires (26.5%).