Trumbull: Fire Incidents, Connecticut (CT)
Where are fire incidents reported in Trumbull, CT
Something went wrong! Please refresh the page.
| Fire incidents reported | |
|---|---|
| Sreet name | Count |
| MAIN STREET | 218 |
| MAIN ST | 112 |
| RT 15 | 82 |
| HUNTINGTON TURNPIKE | 76 |
| WHITE PLAINS ROAD | 68 |
| STROBEL ROAD | 58 |
| AVALON GATES | 54 |
| DANIELS FARM ROAD | 48 |
| MADISON AVENUE | 48 |
| HAWLEY LANE | 44 |
| RT 25 | 44 |
| RT 8 | 38 |
| WHITE PLAINS RD | 38 |
| CHURCH HILL ROAD | 36 |
| EDISON RD | 34 |
| SPRING HILL ROAD | 34 |
| PUTTING GREEN ROAD | 32 |
| MADISON AVE | 26 |
| SHAWNEE ROAD | 26 |
| STONEHOUSE ROAD | 26 |
| BOOTH HILL ROAD | 24 |
| BROADWAY | 24 |
| OLD DYKE ROAD | 24 |
| WILLIAMS ROAD | 24 |
| EDISON ROAD | 22 |
| HUNTINGTON TPKE | 22 |
| LAKE AVENUE | 22 |
| OLD TOWN ROAD | 22 |
| QUALITY STREET | 22 |
| RESERVOIR AVE | 22 |
| Other | 979 |
2002 - 2018 National Fire Incident Reporting System (NFIRS) incidents
- Incident types reported to NFIRS in Trumbull, CT
- 4,28629.1%Hazardous Condition
- 4,09127.7%False Alarm
- 2,34915.9%Fire
- 2,14314.5%Good Intent Call
- 9706.6%Service Call
- 8495.8%Rescue & EMS
- 320.2%Overpressure Rupture
- 220.1%Severe Weather
- Fire incident types reported to NFIRS in Trumbull, CT
- 1,01843.3%Structure Fires
- 67628.8%Outside Fires
- 50921.7%Mobile Property/Vehicle Fires
- 1466.2%Other
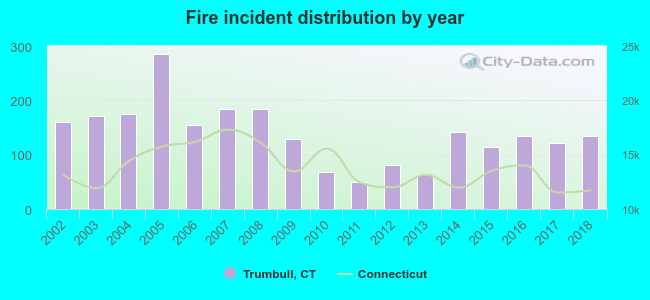 According to the data from the years 2002 - 2018 the average number of fire incidents per year is 138. The highest number of reported fires - 285 took place in 2005, and the least - 49 in 2011. The data has a declining trend.
The average number of yearly fire incidents per 10k residents in Trumbull, CT compared to nearest cities:
(Note: Based on data for the last 3 years, including only cities with population 5,000 and above)
| Trumbull: | 36.1 |
| Easton: | 34.3 |
| Bridgeport: | 30.2 |
| Stratford: | 32.9 |
| Shelton: | 16.1 |
| Monroe: | 45.5 |
| Fairfield: | 22.6 |
| Derby: | 47.0 |
| Milford: | 21.3 |
 The median response time based on all reported fire incidents is 6 minutes. This is comparable to the state median value.
The median response time in Trumbull, CT compared to nearest cities:
(Note: Based on data for all years, including only cities with at least 500 fire incidents)
| Trumbull: | 6 minutes |
| Bridgeport: | 4 minutes |
| Stratford: | 5 minutes |
| Shelton: | 7 minutes |
| Monroe: | 6 minutes |
| Fairfield: | 6 minutes |
| Derby: | 3 minutes |
| Milford: | 5 minutes |
| Weston: | 6 minutes |
 Based on the data from the years 2002 - 2018 the average number of fire-related casualties per year is 0. The highest number of injuries - 4 took place in 2004, and the lowest - 0 in 2002. The data has a constant trend.
The average number of injuries per 1,000 fires is 2. This indicator was the highest - 23 in 2004, and the lowest 0 in 2002. The trend for casualties per 1,000 fires is constant. Compared to the Connecticut value the number of injuries per 1,000 fires is much lower.
Based on the data from the years 2002 - 2018 the average number of fire-related casualties per year is 0. The highest number of injuries - 4 took place in 2004, and the lowest - 0 in 2002. The data has a constant trend.
The average number of injuries per 1,000 fires is 2. This indicator was the highest - 23 in 2004, and the lowest 0 in 2002. The trend for casualties per 1,000 fires is constant. Compared to the Connecticut value the number of injuries per 1,000 fires is much lower.
 29.4% incidents where reported in the morning and 70.6% in the evening. The most fires (17.7%) took place on Monday, and the least (10.6%) on Sunday.
 Based on the 2,349 incident reports from years 2002 - 2018 most fires (10.7%) took place during April, and the least (5.9%) in October.
 Out of all 14,749 cases reported during the years 2002 - 2018, the most belonged to the categories: Hazardous Condition (29.1%), False Alarm (27.7%), and Fire (15.9%).
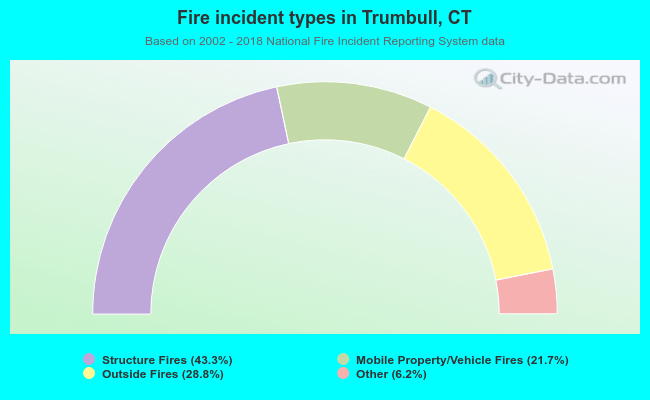 When looking into fire subcategories, the most incidents belonged to: Structure Fires (43.3%), and Outside Fires (28.8%).