Shelton: Fire Incidents, Connecticut (CT)
Where are fire incidents reported in Shelton, CT
Something went wrong! Please refresh the page.
| Fire incidents reported | |
|---|---|
| Sreet name | Count |
| BRIDGEPORT AVE | 234 |
| HOWE AVE | 170 |
| RIVER RD | 136 |
| ROUTE 8 | 132 |
| LEAVENWORTH RD | 126 |
| LONG HILL AVE | 70 |
| CANAL ST | 56 |
| MOHEGAN RD | 44 |
| WALNUT TREE HILL RD | 38 |
| HUNTINGTON ST | 36 |
| CORAM RD | 32 |
| MEADOW ST | 32 |
| SHELTON AVE | 32 |
| BOOTH HILL RD | 28 |
| ROCKY REST RD | 28 |
| CENTER ST | 26 |
| EAST VILLAGE RD | 26 |
| BRIDGE ST | 22 |
| CONSTITUTION BLVD | 20 |
| KNEEN ST | 20 |
| MYRTLE ST | 20 |
| BEARDSLEY RD | 18 |
| PLATT RD | 18 |
| SOUNDVIEW AVE | 18 |
| BLUEBERRY LANE | 16 |
| OLIVER TER | 16 |
| ASBURY RIDGE RD | 14 |
| HUNTINGTON PLAZA | 14 |
| INDIAN WELL RD | 14 |
| MAPLE AVE | 14 |
| Other | 166 |
2002 - 2018 National Fire Incident Reporting System (NFIRS) incidents
- Incident types reported to NFIRS in Shelton, CT
- 3,77341.7%Hazardous Condition
- 1,91621.2%False Alarm
- 1,63618.1%Fire
- 7358.1%Service Call
- 6737.4%Good Intent Call
- 2342.6%Rescue & EMS
- 590.7%Special Incident
- 170.2%Severe Weather
- Fire incident types reported to NFIRS in Shelton, CT
- 79448.5%Structure Fires
- 55834.1%Outside Fires
- 27116.6%Mobile Property/Vehicle Fires
- 130.8%Other
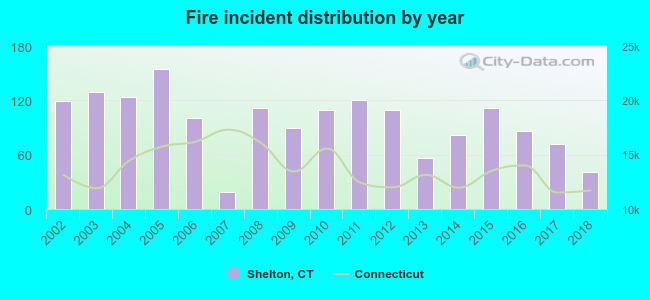 Based on the data from the years 2002 - 2018 the average number of fire incidents per year is 96. The highest number of fires - 155 took place in 2005, and the least - 19 in 2007. The data has a declining trend.
The average number of yearly fire incidents per 10k residents in Shelton, CT compared to nearest cities:
(Note: Based on data for the last 3 years, including only cities with population 5,000 and above)
| Shelton: | 16.1 |
| Derby: | 47.0 |
| Ansonia: | 49.2 |
| Monroe: | 45.5 |
| Trumbull: | 36.1 |
| Orange: | 34.2 |
| Riverside: | 18.6 |
| Seymour: | 29.4 |
| Woodbridge: | 51.2 |
 The median response time based on all reported fire incidents is 7 minutes. This is higher than the state median value.
The median response time in Shelton, CT compared to nearest cities:
(Note: Based on data for all years, including only cities with at least 500 fire incidents)
| Shelton: | 7 minutes |
| Derby: | 3 minutes |
| Ansonia: | 4 minutes |
| Monroe: | 6 minutes |
| Trumbull: | 6 minutes |
| Orange: | 5 minutes |
| Seymour: | 5 minutes |
| Milford: | 5 minutes |
| Stratford: | 5 minutes |
 According to the data from the years 2002 - 2018 the average number of fire-related fatalities per year is 0. The highest number of deaths - 2 took place in 2002, and the lowest - 0 in 2003. The data has a declining trend.
 According to the reports from the years 2002 - 2018 the average number of fire-related casualties per year is 2. The highest number of injuries - 7 took place in 2008, and the lowest - 0 in 2007. The data has a decreasing trend.
The average number of casualties per 1,000 fires is 18. This indicator was the highest - 67 in 2009, and the lowest 0 in 2007. The trend for casualties per 1,000 incidents is declining. Compared to the state value the number of casualties per 1,000 fire incidents is higher.
According to the reports from the years 2002 - 2018 the average number of fire-related casualties per year is 2. The highest number of injuries - 7 took place in 2008, and the lowest - 0 in 2007. The data has a decreasing trend.
The average number of casualties per 1,000 fires is 18. This indicator was the highest - 67 in 2009, and the lowest 0 in 2007. The trend for casualties per 1,000 incidents is declining. Compared to the state value the number of casualties per 1,000 fire incidents is higher.
 30.6% incidents where reported in the morning and 69.4% in the evening. The most fires (15.8%) took place on Saturday, and the least (12.9%) on Friday.
 Based on the 1,636 reports from years 2002 - 2018 most fires (10.5%) took place during April, and the least (7.2%) in November.
 Out of all 9,045 cases reported during the years 2002 - 2018, the most belonged to the categories: Hazardous Condition (41.7%), False Alarm (21.2%), and Fire (18.1%).
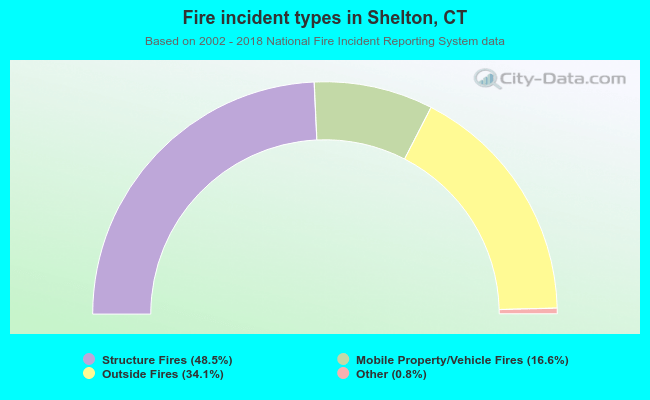 When looking into fire subcategories, the most incidents belonged to: Structure Fires (48.5%), and Outside Fires (34.1%).