Woodbridge: Fire Incidents, Connecticut (CT)
Where are fire incidents reported in Woodbridge, CT
Something went wrong! Please refresh the page.
|
| |||||||||||||||||||||||||||||||||||||||||||||||||||||||||||||||||||||||||||||||||||||||||||||||||||||||||||||
2004 - 2018 National Fire Incident Reporting System (NFIRS) incidents
- Incident types reported to NFIRS in Woodbridge, CT
- 1,59150.6%Hazardous Condition
- 56618.0%False Alarm
- 34310.9%Rescue & EMS
- 33310.6%Fire
- 1845.8%Good Intent Call
- 1243.9%Service Call
- 50.2%Overpressure Rupture
- Fire incident types reported to NFIRS in Woodbridge, CT
- 16148.3%Outside Fires
- 11534.5%Structure Fires
- 4714.1%Mobile Property/Vehicle Fires
- 103.0%Other
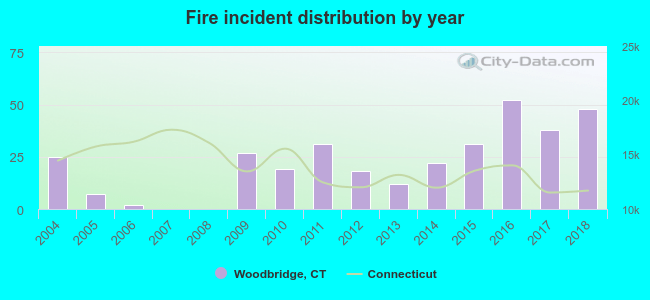 Based on the data from the years 2004 - 2018 the average number of fire incidents per year is 22. The highest number of fires - 52 took place in 2016, and the least - 0 in 2007. The data has a growing trend.
The average number of yearly fire incidents per 10k residents in Woodbridge, CT compared to nearest cities:
(Note: Based on data for the last 3 years, including only cities with population 5,000 and above)
| Woodbridge: | 51.2 |
| Ansonia: | 49.2 |
| Seymour: | 29.4 |
| Derby: | 47.0 |
| Bethany: | 11.4 |
| Hamden: | 29.3 |
| Orange: | 34.2 |
| New Haven: | 29.0 |
| West Haven: | 47.2 |

 28.2% incidents where reported in the morning and 71.8% in the evening. The most fires (16.8%) took place on Wednesday, and the least (10.8%) on Thursday.
 Based on the 333 incident reports from years 2004 - 2018 most fires (13.8%) took place during March, and the least (5.4%) in August.
 Out of all 3,147 cases reported during the years 2004 - 2018, the most belonged to the categories: Hazardous Condition (50.6%), False Alarm (18.0%), and Rescue & EMS (10.9%).
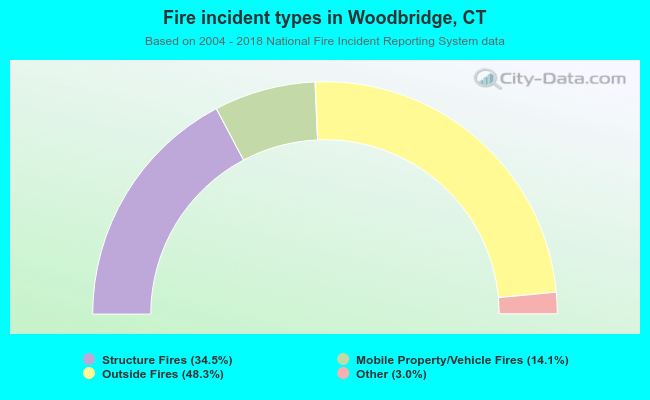 When looking into fire subcategories, the most incidents belonged to: Outside Fires (48.3%), and Structure Fires (34.5%).