New Haven: Fire Incidents, Connecticut (CT)
Where are fire incidents reported in New Haven, CT
Something went wrong! Please refresh the page.
| Fire incidents reported | |
|---|---|
| Sreet name | Count |
| CHAPEL ST | 268 |
| WHALLEY AVE | 242 |
| ELLA T GRASSO BLVD | 146 |
| EDGEWOOD AVE | 140 |
| HOWARD AVE | 134 |
| ELM ST | 130 |
| ORANGE ST | 130 |
| QUINNIPIAC AVE | 130 |
| STATE ST | 110 |
| EASTERN ST | 108 |
| ORCHARD ST | 108 |
| DIXWELL AVE | 100 |
| FERRY ST | 100 |
| GRAND AVE | 98 |
| UNION AVE | 98 |
| NORTON ST | 92 |
| PROSPECT ST | 90 |
| SHERMAN AVE | 90 |
| WINTHROP AVE | 86 |
| GEORGE ST | 82 |
| MANSFIELD ST | 82 |
| FOXON BLVD | 76 |
| WHITNEY AVE | 76 |
| BLAKE ST | 72 |
| FOUNTAIN ST | 70 |
| HOWE ST | 70 |
| WINCHESTER AVE | 66 |
| YORK ST | 64 |
| COLUMBUS AVE | 62 |
| ENGLISH DR | 62 |
| Other | 1,215 |
2004 - 2018 National Fire Incident Reporting System (NFIRS) incidents
- Incident types reported to NFIRS in New Haven, CT
- 44,83066.2%Rescue & EMS
- 6,98410.3%Good Intent Call
- 4,7197.0%Hazardous Condition
- 4,6586.9%False Alarm
- 4,3976.5%Fire
- 1,9512.9%Service Call
- 1150.2%Overpressure Rupture
- Fire incident types reported to NFIRS in New Haven, CT
- 1,53534.9%Structure Fires
- 1,44432.8%Outside Fires
- 79318.0%Mobile Property/Vehicle Fires
- 62514.2%Other
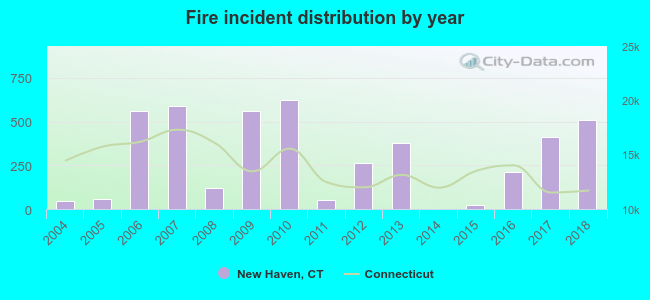 Based on the data from the years 2004 - 2018 the average number of fires per year is 293. The highest number of fires - 621 took place in 2010, and the least - 1 in 2014. The data has an increasing trend.
The average number of yearly fire incidents per 10k residents in New Haven, CT compared to nearest cities:
(Note: Based on data for the last 3 years, including only cities with population 5,000 and above)
| New Haven: | 29.0 |
| East Haven: | 30.2 |
| West Haven: | 47.2 |
| Hamden: | 29.3 |
| Woodbridge: | 51.2 |
| Orange: | 34.2 |
| North Haven: | 56.3 |
| Branford: | 31.0 |
| North Branford: | 19.0 |
 The median response time based on all reported fire incidents is 4 minutes. This is lower compared to the Connecticut median value.
The median response time in New Haven, CT compared to nearest cities:
(Note: Based on data for all years, including only cities with at least 500 fire incidents)
| New Haven: | 4 minutes |
| East Haven: | 4 minutes |
| West Haven: | 4 minutes |
| Hamden: | 4 minutes |
| Orange: | 5 minutes |
| North Haven: | 6 minutes |
| Branford: | 5 minutes |
| North Branford: | 6 minutes |
| Ansonia: | 4 minutes |
 Based on the reports from the years 2004 - 2018 the average number of fire-related yearly deaths is 0. The highest number of reported deaths - 5 took place in 2004, and the lowest - 0 in 2005. The data has a decreasing trend.
The average number of fatalities per 1,000 fires is 9. This indicator was the highest - 106 in 2004, and the lowest 0 in 2005. The trend for deaths per 1,000 incidents is declining. Compared to the Connecticut value the number of deaths per 1,000 fire incidents is about the same.
Based on the reports from the years 2004 - 2018 the average number of fire-related yearly deaths is 0. The highest number of reported deaths - 5 took place in 2004, and the lowest - 0 in 2005. The data has a decreasing trend.
The average number of fatalities per 1,000 fires is 9. This indicator was the highest - 106 in 2004, and the lowest 0 in 2005. The trend for deaths per 1,000 incidents is declining. Compared to the Connecticut value the number of deaths per 1,000 fire incidents is about the same.Deaths per 1,000 incidents in New Haven, CT compared to nearest cities:
(Note: Based on data for all years, including only cities with at least 2,500 fire incidents)
| New Haven: | 1.6 |
| West Haven: | 2.1 |
| Hamden: | 2.1 |
| Wallingford: | 2.2 |
| Stratford: | 2.7 |
| Bridgeport: | 2.5 |
| Meriden: | 1.6 |
| Waterbury: | 0.7 |
| Fairfield: | 4.0 |
 Based on the reports from the years 2004 - 2018 the average number of fire-related casualties per year is 1. The highest number of injuries - 5 took place in 2006, and the lowest - 0 in 2004. The data has an increasing trend.
The average number of casualties per 1,000 fire incidents is 2. This indicator was the highest - 9 in 2006, and the lowest 0 in 2004. The trend for casualties per 1,000 fire incidents is rising. Compared to the state value the number of injuries per 1,000 fires is much lower.
Based on the reports from the years 2004 - 2018 the average number of fire-related casualties per year is 1. The highest number of injuries - 5 took place in 2006, and the lowest - 0 in 2004. The data has an increasing trend.
The average number of casualties per 1,000 fire incidents is 2. This indicator was the highest - 9 in 2006, and the lowest 0 in 2004. The trend for casualties per 1,000 fire incidents is rising. Compared to the state value the number of injuries per 1,000 fires is much lower.Casualties per 1,000 incidents in New Haven, CT compared to nearest cities:
(Note: Based on data for all years, including only cities with at least 500 fire incidents)
| New Haven: | 2.7 |
| East Haven: | 23.6 |
| West Haven: | 13.6 |
| Hamden: | 15.1 |
| Orange: | 14.3 |
| North Haven: | 14.9 |
| Branford: | 18.7 |
| North Branford: | 20.1 |
| Ansonia: | 16.2 |
 32.9% incidents where reported in the morning and 67.1% in the evening. The most fires (15.6%) took place on Saturday, and the least (13.2%) on Wednesday.
 According to the 4,397 fires from years 2004 - 2018 most fires (10.6%) took place during July, and the least (6.1%) in December.
 Out of all 67,735 cases reported during the years 2004 - 2018, the most belonged to the categories: Rescue & EMS (66.2%), Good Intent Call (10.3%), and Hazardous Condition (7.0%).
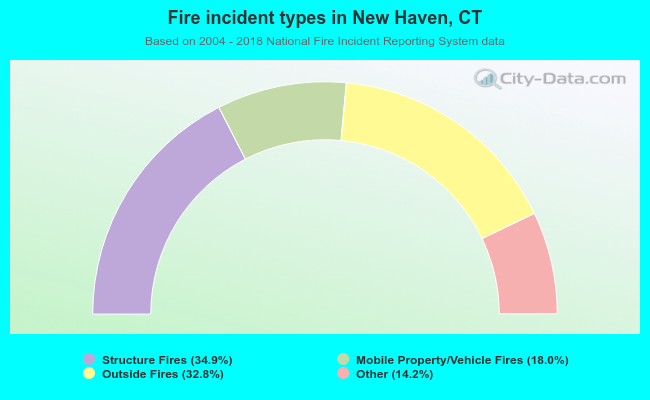 When looking into fire subcategories, the most reports belonged to: Structure Fires (34.9%), and Outside Fires (32.8%).