Waterbury: Fire Incidents, Connecticut (CT)
Where are fire incidents reported in Waterbury, CT
Something went wrong! Please refresh the page.
| Fire incidents reported | |
|---|---|
| Sreet name | Count |
| MAIN ST | 614 |
| E MAIN ST | 310 |
| WOLCOTT ST | 270 |
| COOKE ST | 230 |
| MERIDEN RD | 210 |
| N MAIN ST | 206 |
| BANK ST | 198 |
| LAKEWOOD RD | 186 |
| WILLOW ST | 186 |
| UNION ST | 178 |
| BALDWIN ST | 176 |
| PROSPECT ST | 164 |
| W MAIN ST | 154 |
| PINE ST | 142 |
| WALNUT ST | 136 |
| S MAIN ST | 132 |
| HILL ST | 124 |
| WATERVILLE ST | 112 |
| GROVE ST | 106 |
| GRAND ST | 104 |
| THOMASTON AVE | 104 |
| NORTHRIDGE DR | 102 |
| THOMASTON AV | 102 |
| BISHOP ST | 96 |
| HARRIS CIR | 96 |
| HAMILTON PARK RD | 92 |
| REIDVILLE DR | 90 |
| SCOTT RD | 88 |
| 84E | 86 |
| WOOD ST | 78 |
| Other | 3,266 |
2004 - 2018 National Fire Incident Reporting System (NFIRS) incidents
- Incident types reported to NFIRS in Waterbury, CT
- 50,52360.5%Rescue & EMS
- 10,35512.4%Hazardous Condition
- 8,1389.8%Fire
- 4,9686.0%Service Call
- 4,7265.7%Good Intent Call
- 4,6355.6%False Alarm
- Fire incident types reported to NFIRS in Waterbury, CT
- 4,27552.5%Structure Fires
- 2,48130.5%Outside Fires
- 1,27515.7%Mobile Property/Vehicle Fires
- 1071.3%Other
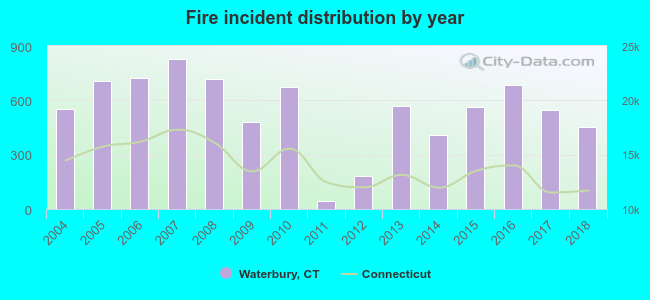 According to the data from the years 2004 - 2018 the average number of fires per year is 543. The highest number of fires - 829 took place in 2007, and the least - 46 in 2011. The data has a decreasing trend.
The average number of yearly fire incidents per 10k residents in Waterbury, CT compared to nearest cities:
(Note: Based on data for the last 3 years, including only cities with population 5,000 and above)
| Waterbury: | 51.4 |
| Oakville: | 21.0 |
| Wolcott: | 22.2 |
| Middlebury: | 29.0 |
| Naugatuck: | 31.4 |
| Watertown: | 17.8 |
| Prospect: | 14.9 |
| Cheshire: | 23.0 |
| Plymouth: | 3.7 |
 The median response time based on all reported fire incidents is 4 minutes. This is lower than the state median value.
The median response time in Waterbury, CT compared to nearest cities:
(Note: Based on data for all years, including only cities with at least 500 fire incidents)
| Waterbury: | 4 minutes |
| Wolcott: | 5 minutes |
| Naugatuck: | 4 minutes |
| Watertown: | 3 minutes |
| Cheshire: | 5 minutes |
| Southington: | 6 minutes |
| Oxford: | 6 minutes |
| Bristol: | 4 minutes |
| Southbury: | 5 minutes |
 According to the reports from the years 2004 - 2018 the average number of fire-related yearly deaths is 0. The highest number of reported deaths - 3 took place in 2006, and the lowest - 0 in 2004. The data has a constant trend.
The average number of deaths per 1,000 fire incidents is 1. This indicator was the highest - 4 in 2006, and the lowest 0 in 2004. The trend for deaths per 1,000 fire incidents is constant. Compared to the Connecticut value the number of fatalities per 1,000 fires is lower.
According to the reports from the years 2004 - 2018 the average number of fire-related yearly deaths is 0. The highest number of reported deaths - 3 took place in 2006, and the lowest - 0 in 2004. The data has a constant trend.
The average number of deaths per 1,000 fire incidents is 1. This indicator was the highest - 4 in 2006, and the lowest 0 in 2004. The trend for deaths per 1,000 fire incidents is constant. Compared to the Connecticut value the number of fatalities per 1,000 fires is lower.Deaths per 1,000 incidents in Waterbury, CT compared to nearest cities:
(Note: Based on data for all years, including only cities with at least 2,500 fire incidents)
| Waterbury: | 0.7 |
| Bristol: | 1.5 |
| Meriden: | 1.6 |
| Wallingford: | 2.2 |
| Hamden: | 2.1 |
| New Britain: | 1.2 |
| New Haven: | 1.6 |
| Middletown: | 0.9 |
| West Haven: | 2.1 |
 Based on the reports from the years 2004 - 2018 the average number of fire-related yearly casualties is 7. The highest number of casualties - 44 took place in 2008, and the lowest - 0 in 2012. The data has a rising trend.
The average number of injuries per 1,000 fire incidents is 12. This indicator was the highest - 61 in 2008, and the lowest 0 in 2012. The trend for injuries per 1,000 fire incidents is increasing. Compared to the Connecticut value the number of injuries per 1,000 fires is about the same.
Based on the reports from the years 2004 - 2018 the average number of fire-related yearly casualties is 7. The highest number of casualties - 44 took place in 2008, and the lowest - 0 in 2012. The data has a rising trend.
The average number of injuries per 1,000 fire incidents is 12. This indicator was the highest - 61 in 2008, and the lowest 0 in 2012. The trend for injuries per 1,000 fire incidents is increasing. Compared to the Connecticut value the number of injuries per 1,000 fires is about the same.
 29.6% incidents where reported in the morning and 70.4% in the evening. The most fires (15.5%) took place on Sunday, and the least (13.6%) on Friday.
 Based on the 8,138 fire incidents from years 2004 - 2018 most fires (11.7%) took place during April, and the least (6.1%) in December.
 Out of all 83,444 cases reported during the years 2004 - 2018, the most belonged to the categories: Rescue & EMS (60.5%), Hazardous Condition (12.4%), and Fire (9.8%).
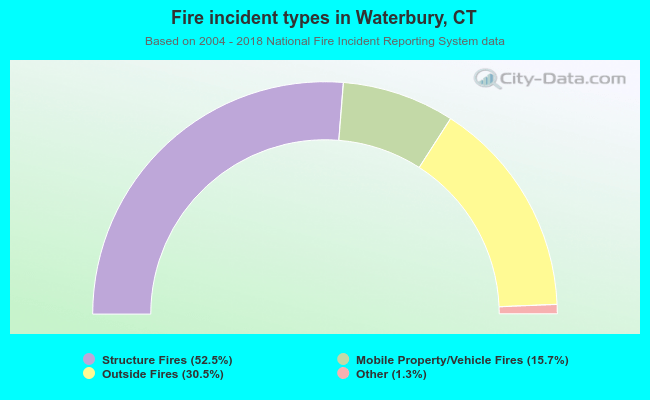 When looking into fire subcategories, the most reports belonged to: Structure Fires (52.5%), and Outside Fires (30.5%).