Naugatuck: Fire Incidents, Connecticut (CT)
Where are fire incidents reported in Naugatuck, CT
Something went wrong! Please refresh the page.
| Fire incidents reported | |
|---|---|
| Sreet name | Count |
| RUBBER AVE | 280 |
| NEW HAVEN RD | 160 |
| NORTH MAIN ST | 96 |
| MILLVILLE AVE | 84 |
| CHURCH ST | 82 |
| SPRING ST | 68 |
| CONRAD ST | 64 |
| PROSPECT ST | 64 |
| ROUTE 8 HWY | 62 |
| HIGH ST | 60 |
| CITY HILL ST | 52 |
| BRIDGE ST | 50 |
| CHERRY ST | 50 |
| MEADOW ST | 46 |
| ANDREW AVE | 44 |
| RIDGE RD | 44 |
| SCOTT ST | 44 |
| MAPLE ST | 42 |
| GORMAN ST | 38 |
| LANTERN PARK DR | 38 |
| LEWIS ST | 38 |
| WOOSTER ST | 38 |
| BEACON VALLEY RD | 36 |
| HORTON HILL RD | 36 |
| SOUTH MAIN ST | 36 |
| FIELD ST | 34 |
| HUNTERS MOUNTAIN RD | 32 |
| MAY ST | 32 |
| NORTH CHURCH ST | 32 |
| OSBORN RD | 32 |
| Other | 223 |
2002 - 2018 National Fire Incident Reporting System (NFIRS) incidents
- Incident types reported to NFIRS in Naugatuck, CT
- 6,16945.5%Hazardous Condition
- 2,03715.0%Fire
- 1,88513.9%False Alarm
- 1,65912.2%Service Call
- 8816.5%Good Intent Call
- 4763.5%Rescue & EMS
- 3792.8%Special Incident
- 560.4%Severe Weather
- Fire incident types reported to NFIRS in Naugatuck, CT
- 1,01549.8%Structure Fires
- 71235.0%Outside Fires
- 24712.1%Mobile Property/Vehicle Fires
- 633.1%Other
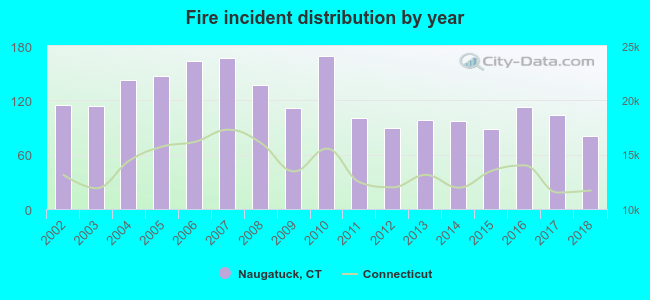 Based on the data from the years 2002 - 2018 the average number of fire incidents per year is 120. The highest number of reported fire incidents - 169 took place in 2010, and the least - 81 in 2018. The data has a declining trend.
The average number of yearly fire incidents per 10k residents in Naugatuck, CT compared to nearest cities:
(Note: Based on data for the last 3 years, including only cities with population 5,000 and above)
| Naugatuck: | 31.4 |
| Prospect: | 14.9 |
| Beacon Falls: | 40.8 |
| Middlebury: | 29.0 |
| Waterbury: | 51.4 |
| Bethany: | 11.4 |
| Oxford: | 26.3 |
| Oakville: | 21.0 |
| Seymour: | 29.4 |
 The median response time based on all reported fire incidents is 4 minutes. This is lower than the state median value.
The median response time in Naugatuck, CT compared to nearest cities:
(Note: Based on data for all years, including only cities with at least 500 fire incidents)
| Naugatuck: | 4 minutes |
| Waterbury: | 4 minutes |
| Oxford: | 6 minutes |
| Seymour: | 5 minutes |
| Cheshire: | 5 minutes |
| Watertown: | 3 minutes |
| Wolcott: | 5 minutes |
| Southbury: | 5 minutes |
| Ansonia: | 4 minutes |
 Based on the data from the years 2002 - 2018 the average number of fire-related fatalities per year is 0. The highest number of reported deaths - 1 took place in 2004, and the lowest - 0 in 2002. The data has an increasing trend.
 Based on the reports from the years 2002 - 2018 the average number of fire-related casualties per year is 2. The highest number of reported injuries - 10 took place in 2016, and the lowest - 0 in 2002. The data has a rising trend.
The average number of casualties per 1,000 fire incidents is 20. This indicator was the highest - 88 in 2016, and the lowest 0 in 2002. The trend for casualties per 1,000 fires is rising. Compared to the state value the number of casualties per 1,000 incidents is higher.
Based on the reports from the years 2002 - 2018 the average number of fire-related casualties per year is 2. The highest number of reported injuries - 10 took place in 2016, and the lowest - 0 in 2002. The data has a rising trend.
The average number of casualties per 1,000 fire incidents is 20. This indicator was the highest - 88 in 2016, and the lowest 0 in 2002. The trend for casualties per 1,000 fires is rising. Compared to the state value the number of casualties per 1,000 incidents is higher.
 29.0% incidents where reported in the morning and 71.0% in the evening. The most fires (16.3%) took place on Sunday, and the least (13.3%) on Tuesday.
 According to the 2,037 fire incident reports from years 2002 - 2018 most fires (11.6%) took place during April, and the least (5.8%) in December.
 Out of all 13,552 cases reported during the years 2002 - 2018, the most belonged to the categories: Hazardous Condition (45.5%), Fire (15.0%), and False Alarm (13.9%).
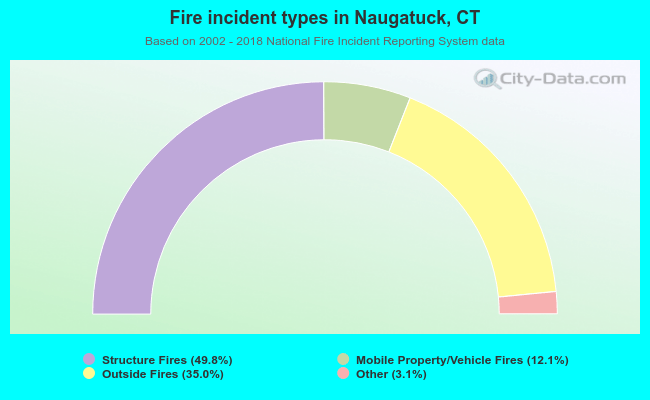 When looking into fire subcategories, the most incidents belonged to: Structure Fires (49.8%), and Outside Fires (35.0%).