Plymouth: Fire Incidents, Connecticut (CT)
Where are fire incidents reported in Plymouth, CT
Something went wrong! Please refresh the page.
|
| |||||||||||||||||||||||||||||||||||||||||||||||||||||||||||||||||||||||||||||||||||||||||||||||||||||||||||||
2003 - 2018 National Fire Incident Reporting System (NFIRS) incidents
- Incident types reported to NFIRS in Plymouth, CT
- 24648.6%Hazardous Condition
- 11723.1%Fire
- 7915.6%Service Call
- 305.9%False Alarm
- 275.3%Good Intent Call
- 61.2%Rescue & EMS
- 10.2%Severe Weather
- Fire incident types reported to NFIRS in Plymouth, CT
- 5748.7%Structure Fires
- 2823.9%Mobile Property/Vehicle Fires
- 2622.2%Outside Fires
- 65.1%Other
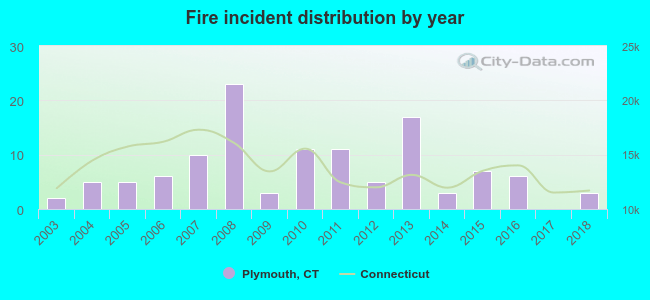 According to the data from the years 2003 - 2018 the average number of fire incidents per year is 7. The highest number of fire incidents - 23 took place in 2008, and the least - 0 in 2017. The data has a growing trend.
The average number of yearly fire incidents per 10k residents in Plymouth, CT compared to nearest cities:
(Note: Based on data for the last 3 years, including only cities with population 5,000 and above)
| Plymouth: | 3.7 |
| Terryville: | 26.0 |
| Thomaston: | 23.2 |
| Bristol: | 35.6 |
| Wolcott: | 22.2 |
| Oakville: | 21.0 |
| Watertown: | 17.8 |
| Harwinton: | 42.5 |
| Burlington: | 28.7 |

 32.5% incidents where reported in the morning and 67.5% in the evening. The most fires (17.9%) took place on Monday, and the least (10.3%) on Wednesday.
 According to the 117 incident reports from years 2003 - 2018 most fires (14.5%) took place during September, and the least (2.6%) in November.
 Out of all 506 cases reported during the years 2003 - 2018, the most belonged to the categories: Rescue & EMS (48.6%), Fire (23.1%), and Hazardous Condition (15.6%).
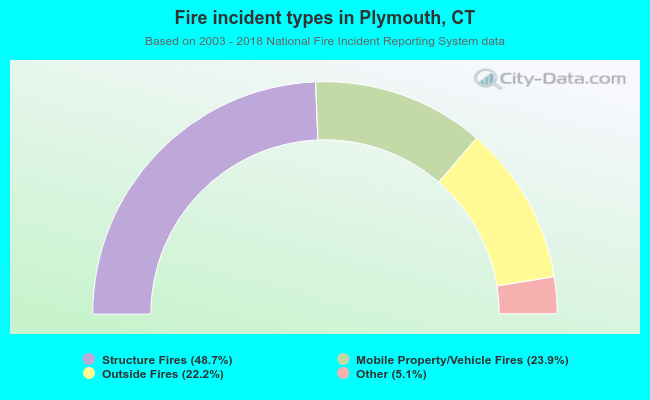 When looking into fire subcategories, the most incidents belonged to: Structure Fires (48.7%), and Mobile Property/Vehicle Fires (23.9%).