Thomaston: Fire Incidents, Connecticut (CT)
Where are fire incidents reported in Thomaston, CT
Something went wrong! Please refresh the page.
|
| |||||||||||||||||||||||||||||||||||||||||||||||||||||||||||||||||||||||||||||||||||||||||||||||||||||||||||||
2002 - 2018 National Fire Incident Reporting System (NFIRS) incidents
- Incident types reported to NFIRS in Thomaston, CT
- 1,36347.4%Hazardous Condition
- 56319.6%Service Call
- 38313.3%Fire
- 30510.6%False Alarm
- 1485.2%Good Intent Call
- 722.5%Rescue & EMS
- 230.8%Special Incident
- 140.5%Severe Weather
- Fire incident types reported to NFIRS in Thomaston, CT
- 16242.3%Structure Fires
- 12332.1%Outside Fires
- 8622.5%Mobile Property/Vehicle Fires
- 123.1%Other
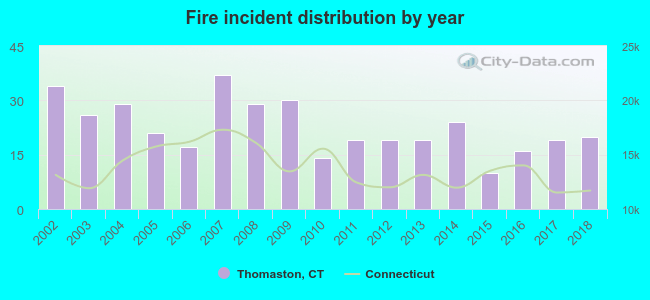 Based on the data from the years 2002 - 2018 the average number of fires per year is 23. The highest number of reported fires - 37 took place in 2007, and the least - 10 in 2015. The data has a decreasing trend.
The average number of yearly fire incidents per 10k residents in Thomaston, CT compared to nearest cities:
(Note: Based on data for the last 3 years, including only cities with population 5,000 and above)
| Thomaston: | 23.2 |
| Plymouth: | 3.7 |
| Terryville: | 26.0 |
| Watertown: | 17.8 |
| Oakville: | 21.0 |
| Harwinton: | 42.5 |
| Wolcott: | 22.2 |
| Bristol: | 35.6 |
| Waterbury: | 51.4 |

 According to the reports from the years 2002 - 2018 the average number of fire-related casualties per year is 0. The highest number of casualties - 2 took place in 2013, and the lowest - 0 in 2002. The data has a constant trend.
 26.9% incidents where reported in the morning and 73.1% in the evening. The most fires (17.0%) took place on Thursday, and the least (10.4%) on Wednesday.
 Based on the 383 incident reports from years 2002 - 2018 most fires (10.7%) took place during April, and the least (5.5%) in September.
 Out of all 2,873 cases reported during the years 2002 - 2018, the most belonged to the categories: Hazardous Condition (47.4%), Service Call (19.6%), and Fire (13.3%).
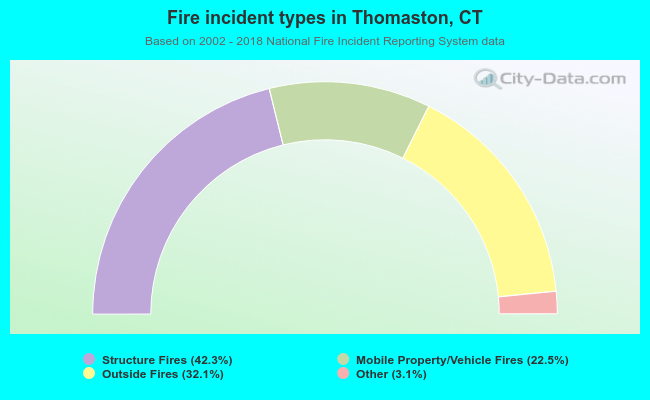 When looking into fire subcategories, the most incidents belonged to: Structure Fires (42.3%), and Outside Fires (32.1%).