Stamford: Fire Incidents, Connecticut (CT)
Where are fire incidents reported in Stamford, CT
Something went wrong! Please refresh the page.
| Fire incidents reported | |
|---|---|
| Sreet name | Count |
| MAIN ST | 486 |
| HIGH RIDGE RD | 410 |
| HOPE ST | 378 |
| WASHINGTON BLVD | 344 |
| SUMMER ST | 328 |
| GREENWICH AVE | 308 |
| GLENBROOK RD | 292 |
| ATLANTIC ST | 272 |
| COVE RD | 268 |
| BEDFORD ST | 248 |
| LONG RIDGE RD | 228 |
| BROAD ST | 224 |
| TRESSER BLVD | 220 |
| NEWFIELD AVE | 196 |
| SHIPPAN AVE | 188 |
| STRAWBERRY HILL AVE | 188 |
| COURTLAND AVE | 156 |
| SPRUCE ST | 148 |
| PALMERS HILL RD | 136 |
| SOUTHFIELD AVE | 132 |
| FOREST ST | 126 |
| STILLWATER AVE | 124 |
| GROVE ST | 116 |
| PROSPECT ST | 110 |
| FAIRFIELD AVE | 108 |
| CANAL ST | 98 |
| SHIPPAN AV | 98 |
| BRIDGE ST | 86 |
| CLINTON AVE | 86 |
| FRANKLIN ST | 84 |
| Other | 2,268 |
2002 - 2018 National Fire Incident Reporting System (NFIRS) incidents
- Incident types reported to NFIRS in Stamford, CT
- 30,65941.6%Rescue & EMS
- 13,77718.7%Hazardous Condition
- 10,85714.7%False Alarm
- 8,45411.5%Fire
- 4,7716.5%Good Intent Call
- 4,6836.4%Service Call
- 2060.3%Overpressure Rupture
- 1350.2%Special Incident
- 920.1%Severe Weather
- Fire incident types reported to NFIRS in Stamford, CT
- 5,10860.4%Structure Fires
- 2,22026.3%Outside Fires
- 91110.8%Mobile Property/Vehicle Fires
- 2152.5%Other
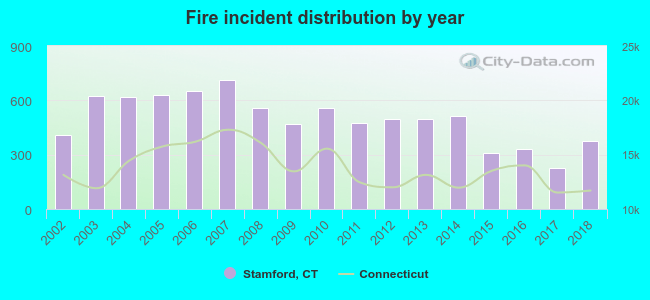 Based on the data from the years 2002 - 2018 the average number of fires per year is 497. The highest number of reported fire incidents - 715 took place in 2007, and the least - 228 in 2017. The data has a decreasing trend.
The average number of yearly fire incidents per 10k residents in Stamford, CT compared to nearest cities:
(Note: Based on data for the last 3 years, including only cities with population 5,000 and above)
| Stamford: | 24.3 |
| Darien: | 23.6 |
| Old Greenwich: | 4.0 |
| Cos Cob: | 30.5 |
| Greenwich: | 14.0 |
| New Canaan: | 22.5 |
| Norwalk: | 29.7 |
| Wilton: | 24.5 |
| Westport: | 32.1 |
 The median response time based on all reported fire incidents is 4 minutes. This is lower compared to the state median value.
The median response time in Stamford, CT compared to nearest cities:
(Note: Based on data for all years, including only cities with at least 500 fire incidents)
| Stamford: | 4 minutes |
| Darien: | 7 minutes |
| Greenwich: | 5 minutes |
| New Canaan: | 6 minutes |
| Norwalk: | 6 minutes |
| Wilton: | 6 minutes |
| Westport: | 5 minutes |
| Weston: | 6 minutes |
| Ridgefield: | 6 minutes |
 According to the data from the years 2002 - 2018 the average number of fire-related fatalities per year is 1. The highest number of reported deaths - 5 took place in 2011, and the lowest - 0 in 2005. The data has a dropping trend.
The average number of deaths per 1,000 fires is 1. This indicator was the highest - 11 in 2011, and the lowest 0 in 2005. The trend for deaths per 1,000 incidents is dropping. Compared to the Connecticut value the number of fatalities per 1,000 fires is similar.
According to the data from the years 2002 - 2018 the average number of fire-related fatalities per year is 1. The highest number of reported deaths - 5 took place in 2011, and the lowest - 0 in 2005. The data has a dropping trend.
The average number of deaths per 1,000 fires is 1. This indicator was the highest - 11 in 2011, and the lowest 0 in 2005. The trend for deaths per 1,000 incidents is dropping. Compared to the Connecticut value the number of fatalities per 1,000 fires is similar.
 According to the reports from the years 2002 - 2018 the average number of fire-related yearly casualties is 5. The highest number of casualties - 24 took place in 2004, and the lowest - 0 in 2015. The data has a declining trend.
The average number of injuries per 1,000 fire incidents is 10. This indicator was the highest - 39 in 2004, and the lowest 0 in 2015. The trend for casualties per 1,000 fire incidents is declining. Compared to the Connecticut value the number of casualties per 1,000 fires is similar.
According to the reports from the years 2002 - 2018 the average number of fire-related yearly casualties is 5. The highest number of casualties - 24 took place in 2004, and the lowest - 0 in 2015. The data has a declining trend.
The average number of injuries per 1,000 fire incidents is 10. This indicator was the highest - 39 in 2004, and the lowest 0 in 2015. The trend for casualties per 1,000 fire incidents is declining. Compared to the Connecticut value the number of casualties per 1,000 fires is similar.Casualties per 1,000 incidents in Stamford, CT compared to nearest cities:
(Note: Based on data for all years, including only cities with at least 500 fire incidents)
| Stamford: | 10.5 |
| Darien: | 3.0 |
| Greenwich: | 9.8 |
| New Canaan: | 10.3 |
| Norwalk: | 7.0 |
| Wilton: | 2.7 |
| Westport: | 12.4 |
| Weston: | 1.8 |
| Ridgefield: | 6.7 |
 30.0% incidents where reported in the morning and 70.0% in the evening. The most fires (15.6%) took place on Sunday, and the least (13.7%) on Monday.
 Based on the 8,454 fires from years 2002 - 2018 most fires (9.7%) took place during April, and the least (7.5%) in August.
 Out of all 73,634 cases reported during the years 2002 - 2018, the most belonged to the categories: Rescue & EMS (41.6%), Hazardous Condition (18.7%), and False Alarm (14.7%).
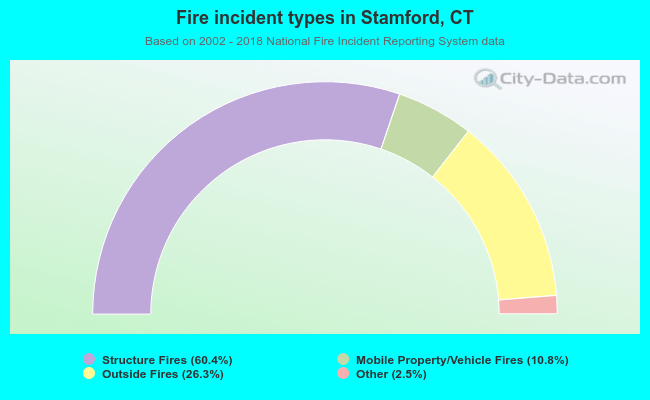 When looking into fire subcategories, the most incidents belonged to: Structure Fires (60.4%), and Outside Fires (26.3%).