Greenwich: Fire Incidents, Connecticut (CT)
Where are fire incidents reported in Greenwich, CT
Something went wrong! Please refresh the page.
| Fire incidents reported | |
|---|---|
| Sreet name | Count |
| I95S | 108 |
| I95N | 98 |
| PUTNAM AVE | 80 |
| RT15N | 66 |
| RT15S | 56 |
| GREENWICH AVE | 48 |
| KING ST | 48 |
| NORTH ST | 40 |
| RIVERSVILLE RD | 36 |
| LAKE AVE | 32 |
| ROUND HILL RD | 32 |
| PUTNAM AV | 28 |
| WEAVER ST | 28 |
| FIELD POINT RD | 26 |
| OLD MILL RD | 26 |
| GREENWICH AV | 24 |
| HAMILTON AVE | 22 |
| JOHN ST | 22 |
| PERKINS RD | 22 |
| TACONIC RD | 22 |
| ELM ST | 20 |
| GLENVILLE RD | 20 |
| LAKE AV | 20 |
| PEMBERWICK RD | 20 |
| ARCH ST | 16 |
| BYRAM SHORE RD | 16 |
| CLAPBOARD RIDGE RD | 16 |
| DINGLETOWN RD | 16 |
| HAVEMEYER PL | 16 |
| LOWER CROSS RD | 16 |
| Other | 183 |
2007 - 2018 National Fire Incident Reporting System (NFIRS) incidents
- Incident types reported to NFIRS in Greenwich, CT
- 5,48534.2%False Alarm
- 4,56128.4%Hazardous Condition
- 1,91411.9%Rescue & EMS
- 1,87811.7%Service Call
- 1,2237.6%Fire
- 8165.1%Good Intent Call
- 610.4%Overpressure Rupture
- 530.3%Special Incident
- 420.3%Severe Weather
- Fire incident types reported to NFIRS in Greenwich, CT
- 45437.1%Structure Fires
- 41433.9%Outside Fires
- 26221.4%Mobile Property/Vehicle Fires
- 937.6%Other
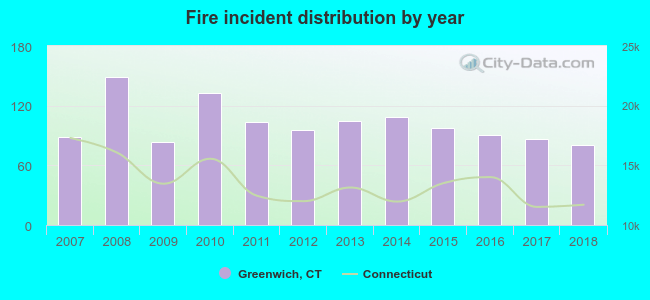 According to the data from the years 2007 - 2018 the average number of fire incidents per year is 102. The highest number of reported fire incidents - 149 took place in 2008, and the least - 80 in 2018. The data has a decreasing trend.
The average number of yearly fire incidents per 10k residents in Greenwich, CT compared to nearest cities:
(Note: Based on data for the last 3 years, including only cities with population 5,000 and above)
| Greenwich: | 14.0 |
| Cos Cob: | 30.5 |
| Old Greenwich: | 4.0 |
| Stamford: | 24.3 |
| Darien: | 23.6 |
| New Canaan: | 22.5 |
| Norwalk: | 29.7 |
| Wilton: | 24.5 |
 The median response time based on all reported fire incidents is 5 minutes. This is close to the Connecticut median value.
The median response time in Greenwich, CT compared to nearest cities:
(Note: Based on data for all years, including only cities with at least 500 fire incidents)
| Greenwich: | 5 minutes |
| Stamford: | 4 minutes |
| Darien: | 7 minutes |
| New Canaan: | 6 minutes |
| Norwalk: | 6 minutes |
| Wilton: | 6 minutes |
 Based on the data from the years 2007 - 2018 the average number of fire-related yearly casualties is 1. The highest number of reported casualties - 4 took place in 2011, and the lowest - 0 in 2007. The data has a constant trend.
The average number of casualties per 1,000 fires is 9. This indicator was the highest - 38 in 2011, and the lowest 0 in 2007. The trend for casualties per 1,000 fire incidents is constant. Compared to the state value the number of injuries per 1,000 incidents is lower.
Based on the data from the years 2007 - 2018 the average number of fire-related yearly casualties is 1. The highest number of reported casualties - 4 took place in 2011, and the lowest - 0 in 2007. The data has a constant trend.
The average number of casualties per 1,000 fires is 9. This indicator was the highest - 38 in 2011, and the lowest 0 in 2007. The trend for casualties per 1,000 fire incidents is constant. Compared to the state value the number of injuries per 1,000 incidents is lower.Casualties per 1,000 incidents in Greenwich, CT compared to nearest cities:
(Note: Based on data for all years, including only cities with at least 500 fire incidents)
| Greenwich: | 9.8 |
| Stamford: | 10.5 |
| Darien: | 3.0 |
| New Canaan: | 10.3 |
| Norwalk: | 7.0 |
| Wilton: | 2.7 |
 31.4% incidents where reported in the morning and 68.6% in the evening. The most fires (16.6%) took place on Monday, and the least (11.6%) on Tuesday.
 Based on the 1,223 incident reports from years 2007 - 2018 most fires (10.5%) took place during April, and the least (5.9%) in February.
 Out of all 16,033 cases reported during the years 2007 - 2018, the most belonged to the categories: False Alarm (34.2%), Hazardous Condition (28.4%), and Rescue & EMS (11.9%).
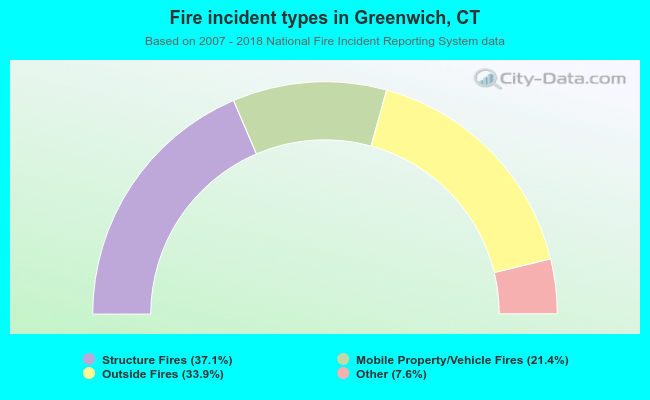 When looking into fire subcategories, the most incidents belonged to: Structure Fires (37.1%), and Outside Fires (33.9%).