New Milford: Fire Incidents, Connecticut (CT)
Where are fire incidents reported in New Milford, CT
Something went wrong! Please refresh the page.
| Fire incidents reported | |
|---|---|
| Sreet name | Count |
| DANBURY RD | 226 |
| KENT RD | 60 |
| WILLOW SPRINGS | 52 |
| PICKETT DISTRICT RD | 44 |
| BRIDGE ST | 38 |
| GROVE ST | 36 |
| ASPETUCK VILLAGE | 34 |
| BOARDMAN RD | 34 |
| MERRYALL RD | 28 |
| LONG MOUNTAIN RD | 24 |
| SUNNY VALLEY RD | 24 |
| HOUSATONIC AVE | 22 |
| LITCHFIELD RD | 22 |
| PARKLANE RD | 22 |
| CANDLEWOOD MTN. RD | 20 |
| MAIN ST | 20 |
| OLD STATE RD | 20 |
| PUMPKIN HILL RD | 20 |
| RIDGE RD | 20 |
| WELLSVILLE AVE | 20 |
| ASPETUCK RIDGE RD | 16 |
| BRIDGEWATER RD | 16 |
| CANDLEWOOD LK. RD. N. | 16 |
| CHESTNUTLAND RD | 16 |
| LONE OAK DR | 16 |
| WEST ST | 16 |
| CANDLEWOOD LK. RD. S. | 14 |
| OLD TOWN PARK RD | 14 |
| YOUNG'S FIELD RD | 14 |
| ALDRICH RD | 12 |
| Other | 355 |
2002 - 2018 National Fire Incident Reporting System (NFIRS) incidents
- Incident types reported to NFIRS in New Milford, CT
- 1,96433.6%Hazardous Condition
- 1,29122.1%Fire
- 1,02417.5%False Alarm
- 72812.5%Service Call
- 4197.2%Good Intent Call
- 3966.8%Rescue & EMS
- 150.3%Severe Weather
- Fire incident types reported to NFIRS in New Milford, CT
- 69253.6%Structure Fires
- 37529.0%Outside Fires
- 16212.5%Mobile Property/Vehicle Fires
- 624.8%Other
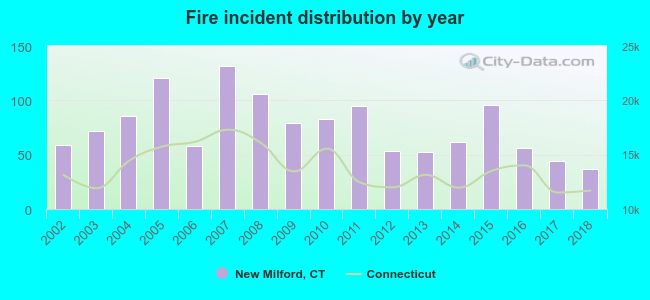 Based on the data from the years 2002 - 2018 the average number of fires per year is 76. The highest number of fires - 132 took place in 2007, and the least - 37 in 2018. The data has a decreasing trend.
The average number of yearly fire incidents per 10k residents in New Milford, CT compared to nearest cities:
(Note: Based on data for the last 3 years, including only cities with population 5,000 and above)
| New Milford: | 70.0 |
| Brookfield: | 22.3 |
| New Fairfield: | 15.6 |
| Woodbury: | 18.4 |
| Southbury: | 30.6 |
| Danbury: | 19.2 |
| Bethel: | 73.3 |
| Middlebury: | 29.0 |
| Watertown: | 17.8 |
 The median response time based on all reported fire incidents is 7 minutes. This is higher compared to the Connecticut median value.
The median response time in New Milford, CT compared to nearest cities:
(Note: Based on data for all years, including only cities with at least 500 fire incidents)
| New Milford: | 7 minutes |
| Brookfield: | 6 minutes |
| New Fairfield: | 7 minutes |
| Southbury: | 5 minutes |
| Danbury: | 5 minutes |
| Newtown: | 7 minutes |
| Bethel: | 6 minutes |
| Watertown: | 3 minutes |
| Oxford: | 6 minutes |
 Based on the reports from the years 2002 - 2018 the average number of fire-related yearly deaths is 0. The highest number of reported deaths - 1 took place in 2005, and the lowest - 0 in 2002. The data has a constant trend.
 Based on the reports from the years 2002 - 2018 the average number of fire-related casualties per year is 2. The highest number of reported casualties - 6 took place in 2005, and the lowest - 0 in 2012. The data has a decreasing trend.
The average number of injuries per 1,000 fire incidents is 27. This indicator was the highest - 81 in 2014, and the lowest 0 in 2012. The trend for casualties per 1,000 incidents is decreasing. Compared to the Connecticut value the number of casualties per 1,000 incidents is much higher.
Based on the reports from the years 2002 - 2018 the average number of fire-related casualties per year is 2. The highest number of reported casualties - 6 took place in 2005, and the lowest - 0 in 2012. The data has a decreasing trend.
The average number of injuries per 1,000 fire incidents is 27. This indicator was the highest - 81 in 2014, and the lowest 0 in 2012. The trend for casualties per 1,000 incidents is decreasing. Compared to the Connecticut value the number of casualties per 1,000 incidents is much higher.Casualties per 1,000 incidents in New Milford, CT compared to nearest cities:
(Note: Based on data for all years, including only cities with at least 500 fire incidents)
| New Milford: | 29.4 |
| Brookfield: | 5.9 |
| New Fairfield: | 14.3 |
| Southbury: | 4.1 |
| Danbury: | 20.3 |
| Newtown: | 11.1 |
| Bethel: | 10.8 |
| Watertown: | 10.0 |
| Oxford: | 17.3 |
 27.6% incidents where reported in the morning and 72.4% in the evening. The most fires (15.8%) took place on Sunday, and the least (12.1%) on Tuesday.
 According to the 1,291 fires from years 2002 - 2018 most fires (12.9%) took place during January, and the least (4.8%) in September.
 Out of all 5,840 cases reported during the years 2002 - 2018, the most belonged to the categories: Hazardous Condition (33.6%), Fire (22.1%), and False Alarm (17.5%).
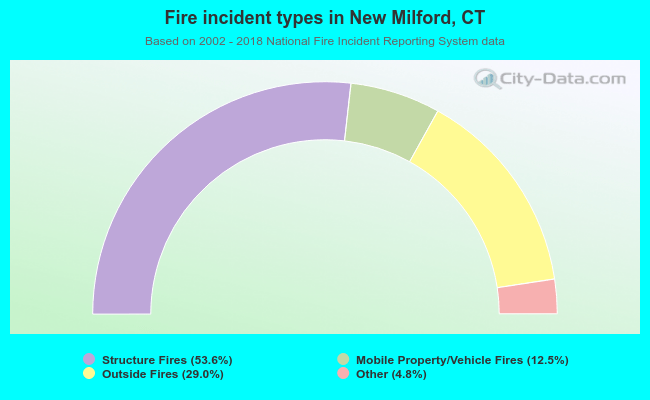 When looking into fire subcategories, the most incidents belonged to: Structure Fires (53.6%), and Outside Fires (29.0%).