| Fire incidents reported |
|---|
| Sreet name | Count |
|---|
| MAIN ST | 44 | | MIDDLE ROAD TURNPIKE | 18 | | MAIN STREET SOUTH | 16 | | GOOD HILL RD | 14 | | WHITE DEER ROCKS ROAD | 14 | | FLANDERS ROAD | 12 | | MAIN STREET SOUTH (RT 6) | 12 | | TUTTLE ROAD | 12 | | WASHINGTON RD | 12 | | CHURCH STREET | 10 | | HOOP POLE HILL ROAD | 10 | | MAIN STREET NORTH (RT 6) | 10 | | MOUNTAIN ROAD | 10 | | QUASSUK RD | 10 | | WASHINGTON ROAD (RT 47) | 10 | | BACON POND RD | 8 | | FLANDERS RD | 8 | | NETTLETON HOLLOW ROAD | 8 | | OLD SHERMAN HILL ROAD | 8 | | RAILTREE HILL ROAD | 8 | | UPPER GRASSY HILL RD | 8 | | WOODSIDE CIR | 8 | | BETHLEHEM RD | 6 | | CLUBHOUSE DR | 6 | | GRASSY HILL ROAD | 6 |
| | | Fire incidents reported |
|---|
| Sreet name | Count |
|---|
| HOLLOW ROAD | 6 | | JOSHUA HILL ROAD | 6 | | KIMBERLY LN | 6 | | OLD TOWN FARM ROAD | 6 | | QUASSUK ROAD | 6 | | STAGECOACH ROAD | 6 | | TRANSYLVANIA ROAD | 6 | | UPPER GRASSY HILL ROAD | 6 | | WASHINGTON ROAD | 6 | | WEEKEEPEEMEE RD | 6 | | WEEKEEPEEMEE ROAD | 6 | | BACON POND ROAD | 4 | | CAT SWAMP RD | 4 | | CHURCH HILL RD | 4 | | CHURCH HILL ROAD | 4 | | ELEPHANT ROCK ROAD | 4 | | GRASSY HILL RD | 4 | | HARD HILL ROAD | 4 | | HAZEL PLAIN ROAD | 4 | | JOSHUA HILL RD | 4 | | JUDSON AVENUE | 4 | | KIMBERLY LANE | 4 | | LAKE RD | 4 | | LIGHTHOUSE RD. | 4 | | |
|
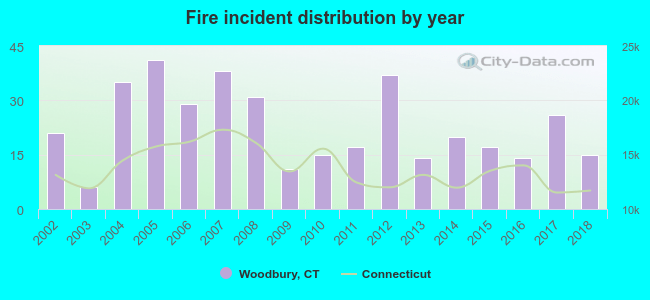 Based on the data from the years 2002 - 2018 the average number of fire incidents per year is 23. The highest number of fires - 41 took place in 2005, and the least - 6 in 2003. The data has a dropping trend.
 28.7% incidents where reported in the morning and 71.3% in the evening. The most fires (16.3%) took place on Tuesday, and the least (12.7%) on Thursday.
 According to the 387 reports from years 2002 - 2018 most fires (11.9%) took place during March, and the least (4.9%) in August.
 Out of all 2,365 cases reported during the years 2002 - 2018, the most belonged to the categories: Rescue & EMS (33.0%), Good Intent Call (23.0%), and Fire (16.4%).
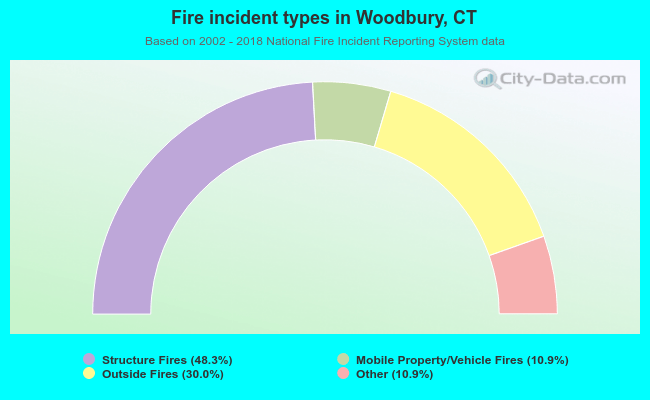 When looking into fire subcategories, the most reports belonged to: Structure Fires (48.3%), and Outside Fires (30.0%).