Please register to participate in our discussions with 2 million other members - it's free and quick! Some forums can only be seen by registered members. After you create your account, you'll be able to customize options and access all our 15,000 new posts/day with fewer ads.
TWC has a graphic (http://www.weather.com/outlook/weather-news/news/articles/record-march-warmth_2012-03-17 - broken link) (scroll down the page) of tomorrow's forecast near-records or records being broken, but it's just for the U.S. Interestingly enough a few spots in California will be close to record lows, which is the first near-record low spots I've seen in a while when a map like that has been brought out (curiously enough it was mostly last Spring TWC had that graphic style).
Is there any graphic anybody knows of of this heatwave in North America showing the geographic extent of where places have been getting record temps (and where, if anywhere, is abnormally cold to balance it out)? So far from this forum I've got from Winnipeg to Colorado to the Mid-Atlantic coast upwards and to Toronto - anywhere further afield getting record/abnormal heat?
Is there any graphic anybody knows of of this heatwave in North America showing the geographic extent of where places have been getting record temps (and where, if anywhere, is abnormally cold to balance it out)? So far from this forum I've got from Winnipeg to Colorado to the Mid-Atlantic coast upwards and to Toronto - anywhere further afield getting record/abnormal heat?
To be fair, Colorado was one of those places that DID have a winter as opposed to the rest of the a nation. We had about average temps and above average precip. Where I live we've had 82.5 inches of snow compared to the average 60. Denver officially has had 60 something I believe. It was only when March started that we all of a sudden hit May-like temps (12 days with April/May high temps with April lows), and only about 5 days with below average temps (Feb norms). These 5 days were usually just one-two day cold fronts, but it's been fast to warm up right afterwards, something we don't usually see til mid-April/May. This also shows how much snow was lacking across the country. For most of the year only Alaska and Colorado were in the top 5 blowing away the competition, but some late storm brought others up on the charts. By the look of things though, most places are done with measurable snow except on the WEst side. Check out the stats here:
TWC has a graphic (http://www.weather.com/outlook/weather-news/news/articles/record-march-warmth_2012-03-17 - broken link) (scroll down the page) of tomorrow's forecast near-records or records being broken, but it's just for the U.S. Interestingly enough a few spots in California will be close to record lows, which is the first near-record low spots I've seen in a while when a map like that has been brought out (curiously enough it was mostly last Spring TWC had that graphic style).
That's more like it! I'm impressed as ever with the statistical attention American weather broadcasters/agencies give to new records being set/unusual weather in general I wasn't aware it had been particularly warm in the west as well, also very odd that no record high lows have been set or any other records?
The temperature map for Tuesday deserves a mention on here for the colour scheme alone:
and also this one - a million sq miles or so completely off the chart!
It feels like I'm in a parallel world or alternate reality, because of this pretty much May to June-like weather in March (it might as well even feel like July, if the temps forecasted hold up) lasting long enough that I've taken it for granted for about a week and find it hard to imagine snapping back (can't speak too soon!) but yet it still looks like March (by the trees etc.). Seeing the kids end their March/spring break and playing outdoors and realizing that I never had such a warm spring break before when I was growing up (most of the time there were at least freezing temps) also adds to the unusual feeling.
and also this one - a million sq miles or so completely off the chart!
Given that 10 to 20 degrees Fahrenheit above or below normal is quite common in the United States, that map's scale should definitely be expanded. If I were creating a color scale I'd go from -50 to +50 from normal, instead of just -8 to +8.
What goes up must come down? We dont have "averages" from one type of pattern.
So expect a time frame of WELL BELOW temps. The question is when... Maybe the longer this lasts the longer we need to be below average to make up for lost time.
Summer fans better hope it happens in summer otherwise next winter could be a Europe like Winter for U.S.
Its been a very average march so far here in Hertfordshire, just north of London. Temps near average, a few frosts, a bit of snow, and a couple of days around or above 15c/60f.
Above average here by quite a margin - mean maximum is 3.6C, 1 air frost and no snow - it snowed further south though as that band of rain moved south.
Please register to post and access all features of our very popular forum. It is free and quick. Over $68,000 in prizes has already been given out to active posters on our forum. Additional giveaways are planned.
Detailed information about all U.S. cities, counties, and zip codes on our site: City-data.com.

 Please register to participate in our discussions with 2 million other members - it's free and quick! Some forums can only be seen by registered members. After you create your account, you'll be able to customize options and access all our 15,000 new posts/day with fewer ads.


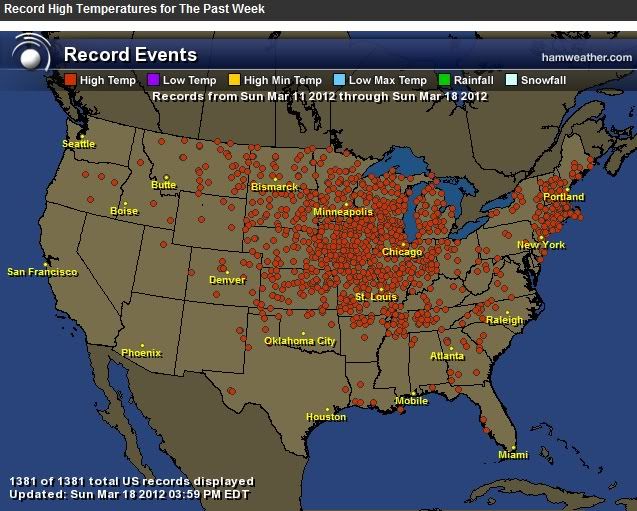
 I wasn't aware it had been particularly warm in the west as well, also very odd that no record high lows have been set or any other records?
 :
:


