Please register to participate in our discussions with 2 million other members - it's free and quick! Some forums can only be seen by registered members. After you create your account, you'll be able to customize options and access all our 15,000 new posts/day with fewer ads.
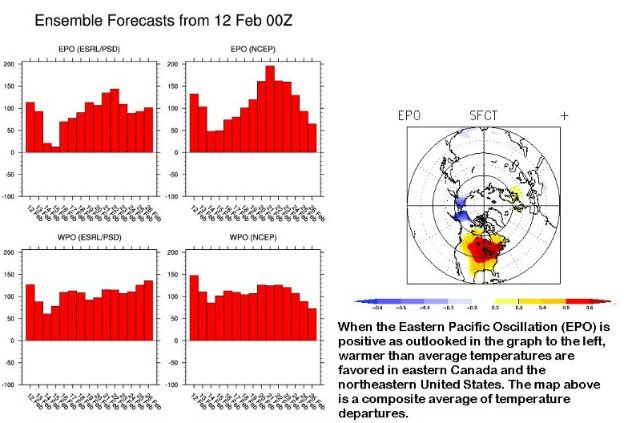
Here's another 3 letter abbrivation to remember... EPO. Take a look at our anomaly map I posted above for this winter and take a look at the map of a positive EPO.
This is from NWS in Mount Holly. Lots of good info.
"So how does the second half of February look? We have posted information on the North Atlantic Oscillation (NAO) and today we want to take us into the Pacific Ocean and talk about the Eastern Pacific Oscillation (EPO). The EPO does not get as much press as some of the other teleconnective indices, but does have an effect on our weather.
In general terms this teleconnective index calculates th...e difference in 500mb (halfway through our atmosphere) levels in the mid latitudes in the Eastern Pacific Ocean. The greater the difference is from normal, the more positive the index. Conversely the lesser the difference from normal, the more negative the index. So when the EPO is positive, a strong zonal (west to east) flow is entering North America and it becomes harder for colder than normal weather to occur. When the EPO is negative, there is usually a ridge that extends north into Alaska. This becomes a good breeding ground for arctic high pressure systems to either form or move into North America from Siberia.
So how is the Eastern Pacific Oscillation (EPO) outlooked for the next one to two weeks? Below is a graph of both the EPO and its sister index the WPO from the Earth System Research Lab in Boulder, Colorado off the 00z GFS model. This research lab beside calculating the EPO (upper right graph), applies a bias correction to the GFS outlooks and then re-calculates the teleconnection index (upper left index). In this example, they are pretty close. As far as our sensible weather goes, it will be tougher over the next two weeks to get unseasonably cold shots of air into our area (as if this is much different than how our winter has gone so far). The one caveat is if any blocking develops in the western north Atlantic Ocean. This would force colder air from Canada (even if it originally comes in off the Pacific Ocean) to move southward into our area. Right now strong blocking in the western north Atlantic is not outlooked. So the latest 6 to 10 day and 8 to 14 day outlooks from the Climate Prediction Center (CPC) and the week two NAEFS temperature outlook maintains normal to above normal temperatures to prevail. "
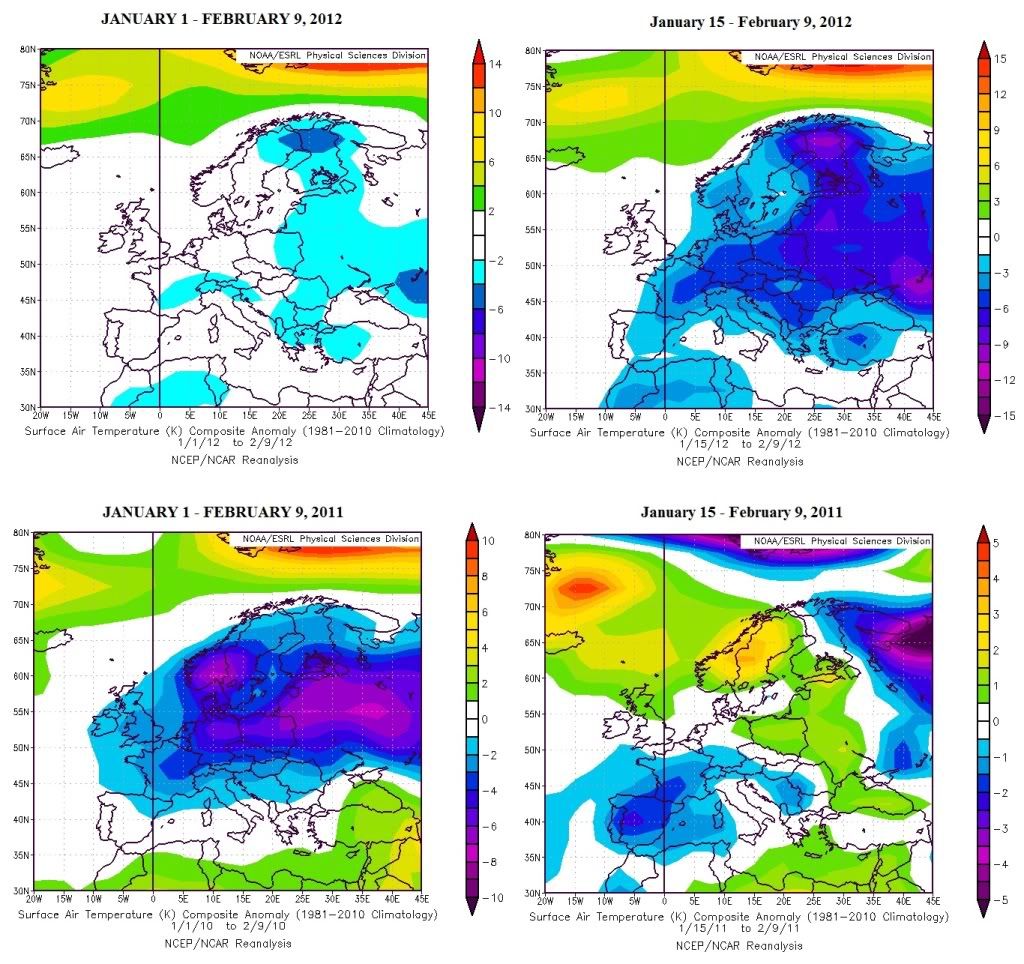
Top Left: If we use January 1st to present day it does not show many areas of below normal temps. Thats because it started after mid January this year.
Top Right: Notice the much below normal temps and more widespread and as far south as Spain and Northern Africa. Not much warmth except at the poles this year.
Bottom Left: January 1st to present day last year shows cold. This is only because it actually started in December and warmed up by February.
Bottom Right: Starting mid January to present day 2011 notice the cold air retreated and above normal temps happened in many areas.
I think when we talk about the cold that happened last year we dont realize there were areas nearby of above normal temps and the below normal temps didnt get that far south last year.
Such conditions are close to average here, but the majority of this winter has been in the 40s. Still pleasantly cool temperatures, but would be nice to get more wintry weather.
Yes I understand you, living in a climate with such nice winter averages it's quite a shame to be constantly above them.
Here we went from your typical weather to ours. Today was 5/-1°C, drizzly and overcast. It feels quite damp outside. Even if the last rain dates only from January 28th it felt like it's been months. If there weren't iced ponds and lakes, one wouldn't notice that it was cold recently, as there is no snow to melt.
That was one of the coldest Mt. Washington has gotten recently, or at least in the last decade, and one of the colder "arctic blasts" for the northeast recently. I remember being in Long Island with a daytime high of about 13°F (-10°C) — very cold for the coast; and bicycling in it. The harbors had frozen over. Interior of the northeast struggled to go above 0°F. That whole month was one of the coldest in recent decades.
Only one month after 1920 was colder than January 2004 in New York City. In contrast, last January averaged about 37°F in NYC; warmer than average but closer to the average than January 2004.
Looking at your models, it's clear (at least from what I can understand) what the setup was; high and low pressure systems sitting in a position that created a strong arctic airflow from Northern Canada and cooled very little. Looked like someone left the door ajar. While Europe was getting weather off the Atlantic, keeping it mild.
Yes looking at the models I'm not surprised by these very low high temps. It must have been fun back then for cold lovers.
Quote:
northern New England sits in a spot where the pressure lines run close together, making the winds stronger. And Mt. Washington has a shape and stick out enough to funnel the wind over the summit and magnify it.
Is this correct?
The website with the models looks really interesting. Thanks!
You're welcome. As for the wind you seem to get a lot of intense storms not far from the coast. Looking at the models, I noticed that clashes between air masses were usually much more violent over eastern North America than Western Europe. Your map from October 30th, 2011 is an example with -8°C over Saint Lawrence and 16°C about 500 km (?) off the coast while in Western Europe 850 mb isotherms are much further from each other.
Something like this is quite rare over here. European cold lovers have fond memories of this huge air mass conflict. It triggered massive snowfalls and a 20°C temp fall in a few hours: Meteociel - Archives des analyses NCEP de 1871 aujourd'hui
Out of curiosity, I downloaded the data from my station to see how often warm winters were followed by above average spring weather. I took the Jan-Feb average and compared it to the March and April averages. The correlation between the Jan-Feb average and the March average was low, only about 0.14.
But when I compared the Marches followed the top 20 warmest Jan/Feb (> 3°F above average) the connection was fairly strong, a correlation of 0.37. For April it was weaker, 0.13.
My January was about 6°F above average, December 7°F; dunno what February will be, so far we're running about 6-7°F above average as well. Out of the top 20 warmest Jan-Feb, 13 Marches were above average. For the Jan-Feb that were 6°F above average, 5/6 Marches were above average, and the majority were well above average, though only one was really high (5°F).
This morning probably had the most snow on the ground the whole winter (3 inches from this weekend + 1 inch from last night). I could be in the snowless NE though, so I'm not complaining!
We had a coating of snow Saturday morning and again on Sunday afternoon, but it didn't last long.
Most snow in one day was about 7 inches. I guess that would make our total for the season around 20 inches if you include the October storm. Excluding it, maybe 8 inches.
Please register to post and access all features of our very popular forum. It is free and quick. Over $68,000 in prizes has already been given out to active posters on our forum. Additional giveaways are planned.
Detailed information about all U.S. cities, counties, and zip codes on our site: City-data.com.

 Please register to participate in our discussions with 2 million other members - it's free and quick! Some forums can only be seen by registered members. After you create your account, you'll be able to customize options and access all our 15,000 new posts/day with fewer ads.