Wallingford: Fire Incidents, Connecticut (CT)
Where are fire incidents reported in Wallingford, CT
Something went wrong! Please refresh the page.
| Fire incidents reported | |
|---|---|
| Sreet name | Count |
| COLONY RD | 346 |
| MAIN ST | 182 |
| CHERRY ST | 150 |
| CENTER ST | 140 |
| ELM ST | 114 |
| MASONIC | 92 |
| MASONIC AVE | 86 |
| TURNPIKE RD | 78 |
| ORCHARD ST | 62 |
| PARKER FARMS RD | 62 |
| POND HILL RD | 62 |
| CHESHIRE RD | 58 |
| I 91 | 54 |
| WASHINGTON ST | 54 |
| BROAD ST | 42 |
| WARD ST | 42 |
| CHURCH ST(2) | 38 |
| DURHAM RD | 36 |
| I91 NORTH 13-14 | 36 |
| PLAINS INDUST RD | 34 |
| QUINNIPIAC ST | 34 |
| COLONY | 30 |
| SIDE TER | 30 |
| WHARTON BROOK DR | 30 |
| BARNES RD | 28 |
| BRANFORD RD | 28 |
| CHRISTIAN ST | 28 |
| MAIN ST EXT | 28 |
| PUTTER DR | 28 |
| TREMPER DR | 28 |
| Other | 723 |
2002 - 2018 National Fire Incident Reporting System (NFIRS) incidents
- Incident types reported to NFIRS in Wallingford, CT
- 27,62671.3%Rescue & EMS
- 3,3398.6%False Alarm
- 2,7837.2%Fire
- 2,5356.5%Hazardous Condition
- 1,4333.7%Service Call
- 8892.3%Good Intent Call
- 530.1%Overpressure Rupture
- 430.1%Special Incident
- Fire incident types reported to NFIRS in Wallingford, CT
- 1,21443.6%Structure Fires
- 84330.3%Outside Fires
- 58621.1%Mobile Property/Vehicle Fires
- 1405.0%Other
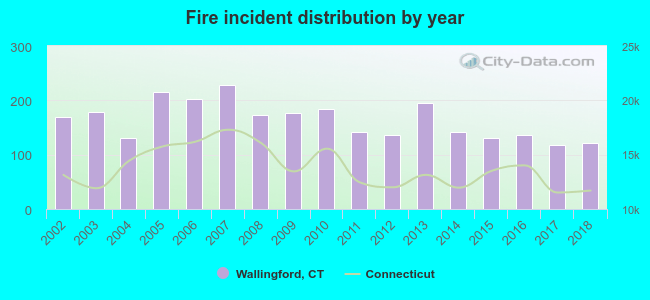 According to the data from the years 2002 - 2018 the average number of fires per year is 164. The highest number of fires - 229 took place in 2007, and the least - 118 in 2017. The data has a decreasing trend.
The average number of yearly fire incidents per 10k residents in Wallingford, CT compared to nearest cities:
(Note: Based on data for the last 3 years, including only cities with population 5,000 and above)
| Wallingford: | 27.8 |
| Meriden: | 36.2 |
| Cheshire: | 23.0 |
| North Haven: | 56.3 |
| North Branford: | 19.0 |
| Hamden: | 29.3 |
| Prospect: | 14.9 |
| Bethany: | 11.4 |
| Middletown: | 37.9 |
 The median response time based on all reported fire incidents is 6 minutes. This is close to the state median value.
The median response time in Wallingford, CT compared to nearest cities:
(Note: Based on data for all years, including only cities with at least 500 fire incidents)
| Wallingford: | 6 minutes |
| Meriden: | 4 minutes |
| Cheshire: | 5 minutes |
| North Haven: | 6 minutes |
| North Branford: | 6 minutes |
| Hamden: | 4 minutes |
| Middletown: | 5 minutes |
| Southington: | 6 minutes |
| New Haven: | 4 minutes |
 According to the reports from the years 2002 - 2018 the average number of fire-related yearly deaths is 0. The highest number of reported deaths - 2 took place in 2016, and the lowest - 0 in 2002. The data has a constant trend.
The average number of deaths per 1,000 fire incidents is 2. This indicator was the highest - 17 in 2017, and the lowest 0 in 2002. The trend for deaths per 1,000 fire incidents is constant. Compared to the Connecticut value the number of fatalities per 1,000 fires is higher.
According to the reports from the years 2002 - 2018 the average number of fire-related yearly deaths is 0. The highest number of reported deaths - 2 took place in 2016, and the lowest - 0 in 2002. The data has a constant trend.
The average number of deaths per 1,000 fire incidents is 2. This indicator was the highest - 17 in 2017, and the lowest 0 in 2002. The trend for deaths per 1,000 fire incidents is constant. Compared to the Connecticut value the number of fatalities per 1,000 fires is higher.Deaths per 1,000 incidents in Wallingford, CT compared to nearest cities:
(Note: Based on data for all years, including only cities with at least 2,500 fire incidents)
| Wallingford: | 2.2 |
| Meriden: | 1.6 |
| Hamden: | 2.1 |
| Middletown: | 0.9 |
| New Haven: | 1.6 |
| Waterbury: | 0.7 |
| West Haven: | 2.1 |
| New Britain: | 1.2 |
| Bristol: | 1.5 |
 Based on the reports from the years 2002 - 2018 the average number of fire-related yearly casualties is 2. The highest number of casualties - 6 took place in 2007, and the lowest - 0 in 2003. The data has a rising trend.
The average number of injuries per 1,000 fire incidents is 14. This indicator was the highest - 34 in 2017, and the lowest 0 in 2003. The trend for injuries per 1,000 fire incidents is increasing. Compared to the Connecticut value the number of injuries per 1,000 fires is about the same.
Based on the reports from the years 2002 - 2018 the average number of fire-related yearly casualties is 2. The highest number of casualties - 6 took place in 2007, and the lowest - 0 in 2003. The data has a rising trend.
The average number of injuries per 1,000 fire incidents is 14. This indicator was the highest - 34 in 2017, and the lowest 0 in 2003. The trend for injuries per 1,000 fire incidents is increasing. Compared to the Connecticut value the number of injuries per 1,000 fires is about the same.Casualties per 1,000 incidents in Wallingford, CT compared to nearest cities:
(Note: Based on data for all years, including only cities with at least 500 fire incidents)
| Wallingford: | 14.4 |
| Meriden: | 12.3 |
| Cheshire: | 13.2 |
| North Haven: | 14.9 |
| North Branford: | 20.1 |
| Hamden: | 15.1 |
| Middletown: | 8.3 |
| Southington: | 23.5 |
| New Haven: | 2.7 |
 27.5% incidents where reported in the morning and 72.5% in the evening. The most fires (15.6%) took place on Saturday, and the least (12.6%) on Wednesday.
 Based on the 2,783 fire incidents from years 2002 - 2018 most fires (11.3%) took place during May, and the least (6.8%) in September.
 Out of all 38,728 cases reported during the years 2002 - 2018, the most belonged to the categories: Rescue & EMS (71.3%), False Alarm (8.6%), and Fire (7.2%).
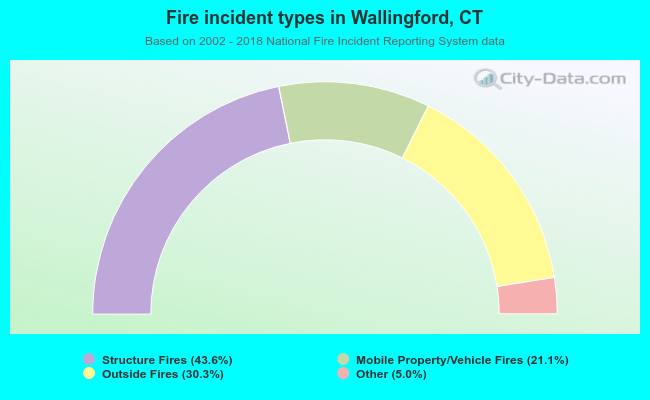 When looking into fire subcategories, the most reports belonged to: Structure Fires (43.6%), and Outside Fires (30.3%).