North Haven: Fire Incidents, Connecticut (CT)
Where are fire incidents reported in North Haven, CT
Something went wrong! Please refresh the page.
| Fire incidents reported | |
|---|---|
| Sreet name | Count |
| WASHINGTON AVE | 202 |
| WASHINGTON AV | 174 |
| POOL RD | 144 |
| POOL RD | 106 |
| UNIVERSAL NORTH DR | 102 |
| STATE ST | 76 |
| UNIVERSAL DR | 72 |
| UNIVERSAL NORTH DR | 72 |
| HARTFORD TPKE | 58 |
| CLINTONVILLE RD | 54 |
| STATE ST | 52 |
| QUINNIPIAC AVE | 48 |
| QUINNIPIAC AV | 42 |
| MIDDLETOWN AVE | 38 |
| RIDGE RD | 38 |
| CLINTONVILLE RD | 36 |
| HARTFORD TPKE | 34 |
| I-91 N/B / EXIT 9 | 34 |
| I91 NB | 34 |
| RIDGE RD | 34 |
| UNIVERSAL DR | 34 |
| I-91 N/B / EXIT 10 | 30 |
| SACKETT POINT RD | 30 |
| MAPLE AV | 28 |
| MIDDLETOWN AV | 28 |
| SACKETT POINT RD | 28 |
| WASHINGTON | 28 |
| RIMMON RD | 26 |
| BASSETT RD | 24 |
| ROCK RD | 24 |
| Other | 348 |
2002 - 2018 National Fire Incident Reporting System (NFIRS) incidents
- Incident types reported to NFIRS in North Haven, CT
- 17,52364.5%Rescue & EMS
- 2,3308.6%False Alarm
- 2,0787.6%Fire
- 2,0157.4%Hazardous Condition
- 1,6186.0%Good Intent Call
- 1,5425.7%Service Call
- 310.1%Severe Weather
- 290.1%Overpressure Rupture
- Fire incident types reported to NFIRS in North Haven, CT
- 78938.0%Structure Fires
- 72134.7%Outside Fires
- 46222.2%Mobile Property/Vehicle Fires
- 1065.1%Other
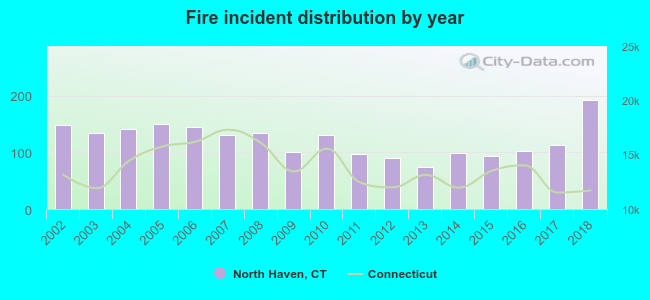 Based on the data from the years 2002 - 2018 the average number of fire incidents per year is 122. The highest number of fire incidents - 192 took place in 2018, and the least - 74 in 2013. The data has an increasing trend.
The average number of yearly fire incidents per 10k residents in North Haven, CT compared to nearest cities:
(Note: Based on data for the last 3 years, including only cities with population 5,000 and above)
| North Haven: | 56.3 |
| Hamden: | 29.3 |
| North Branford: | 19.0 |
| Wallingford: | 27.8 |
| New Haven: | 29.0 |
| East Haven: | 30.2 |
| Branford: | 31.0 |
| Bethany: | 11.4 |
| Woodbridge: | 51.2 |
 The median response time based on all reported fire incidents is 6 minutes. This is about the same as the state median value.
The median response time in North Haven, CT compared to nearest cities:
(Note: Based on data for all years, including only cities with at least 500 fire incidents)
| North Haven: | 6 minutes |
| Hamden: | 4 minutes |
| North Branford: | 6 minutes |
| Wallingford: | 6 minutes |
| New Haven: | 4 minutes |
| East Haven: | 4 minutes |
| Branford: | 5 minutes |
| Cheshire: | 5 minutes |
| West Haven: | 4 minutes |
 According to the reports from the years 2002 - 2018 the average number of fire-related fatalities per year is 0. The highest number of reported deaths - 2 took place in 2014, and the lowest - 0 in 2002. The data has a constant trend.
 According to the data from the years 2002 - 2018 the average number of fire-related casualties per year is 2. The highest number of injuries - 5 took place in 2017, and the lowest - 0 in 2016. The data has a decreasing trend.
The average number of casualties per 1,000 fires is 15. This indicator was the highest - 44 in 2017, and the lowest 0 in 2016. The trend for casualties per 1,000 fire incidents is dropping. Compared to the Connecticut value the number of casualties per 1,000 fires is higher.
According to the data from the years 2002 - 2018 the average number of fire-related casualties per year is 2. The highest number of injuries - 5 took place in 2017, and the lowest - 0 in 2016. The data has a decreasing trend.
The average number of casualties per 1,000 fires is 15. This indicator was the highest - 44 in 2017, and the lowest 0 in 2016. The trend for casualties per 1,000 fire incidents is dropping. Compared to the Connecticut value the number of casualties per 1,000 fires is higher.Casualties per 1,000 incidents in North Haven, CT compared to nearest cities:
(Note: Based on data for all years, including only cities with at least 500 fire incidents)
| North Haven: | 14.9 |
| Hamden: | 15.1 |
| North Branford: | 20.1 |
| Wallingford: | 14.4 |
| New Haven: | 2.7 |
| East Haven: | 23.6 |
| Branford: | 18.7 |
| Cheshire: | 13.2 |
| West Haven: | 13.6 |
 33.0% incidents where reported in the morning and 67.0% in the evening. The most fires (15.0%) took place on Thursday, and the least (12.8%) on Wednesday.
 Based on the 2,078 fire incident reports from years 2002 - 2018 most fires (11.6%) took place during April, and the least (6.6%) in September.
 Out of all 27,186 cases reported during the years 2002 - 2018, the most belonged to the categories: Rescue & EMS (64.5%), False Alarm (8.6%), and Fire (7.6%).
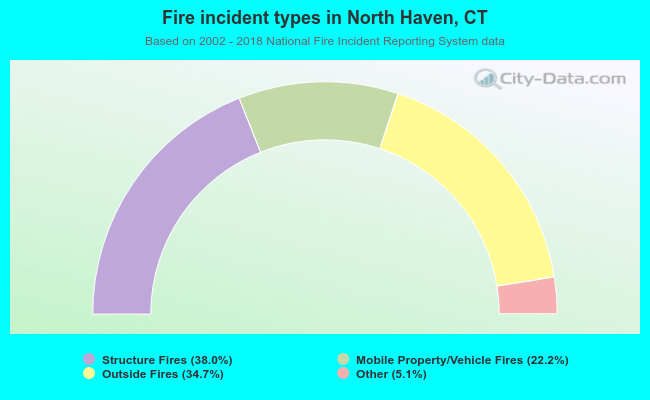 When looking into fire subcategories, the most reports belonged to: Structure Fires (38.0%), and Outside Fires (34.7%).