Branford: Fire Incidents, Connecticut (CT)
Where are fire incidents reported in Branford, CT
Something went wrong! Please refresh the page.
| Fire incidents reported | |
|---|---|
| Sreet name | Count |
| MAIN ST | 168 |
| MAIN ST | 158 |
| INTERSTATE 95 | 92 |
| BRIARWOOD LA | 34 |
| LEETES ISLAND RD | 26 |
| LEETES ISLAND RD | 26 |
| MONTICELLO DR | 24 |
| MONTOWESE ST | 24 |
| MONTICELLO DR | 22 |
| MONTOWESE ST | 22 |
| FLORENCE RD | 18 |
| CONNECTICUT | 16 |
| FLORENCE RD | 16 |
| ALPS RD | 14 |
| BUSINESS PARK DR | 14 |
| CONNECTICUT TNPK | 14 |
| INDUSTRIAL RD | 14 |
| IVY ST | 14 |
| SHORT BEACH RD | 14 |
| BRIARWOOD LN | 12 |
| COMMERCIAL | 12 |
| HARBOR ST | 12 |
| RICE TER | 12 |
| SHORT BEACH RD | 12 |
| BRANFORD | 10 |
| BRUSHY PLAIN RD | 10 |
| CEDAR ST | 10 |
| HARRISON AVE | 10 |
| MAPLE ST | 10 |
| MEADOW ST | 10 |
| Other | 115 |
2002 - 2018 National Fire Incident Reporting System (NFIRS) incidents
- Incident types reported to NFIRS in Branford, CT
- 16,69068.8%Rescue & EMS
- 2,1138.7%Service Call
- 1,8027.4%Hazardous Condition
- 1,6306.7%False Alarm
- 9654.0%Fire
- 9353.9%Good Intent Call
- 490.2%Special Incident
- 350.1%Overpressure Rupture
- Fire incident types reported to NFIRS in Branford, CT
- 43545.1%Structure Fires
- 31132.2%Outside Fires
- 19320.0%Mobile Property/Vehicle Fires
- 262.7%Other
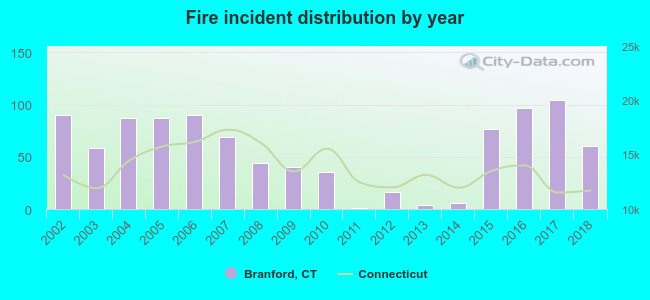 According to the data from the years 2002 - 2018 the average number of fires per year is 57. The highest number of fires - 104 took place in 2017, and the least - 1 in 2011. The data has a declining trend.
The average number of yearly fire incidents per 10k residents in Branford, CT compared to nearest cities:
(Note: Based on data for the last 3 years, including only cities with population 5,000 and above)
| Branford: | 31.0 |
| East Haven: | 30.2 |
| North Branford: | 19.0 |
| Guilford: | 59.3 |
| New Haven: | 29.0 |
| North Haven: | 56.3 |
| West Haven: | 47.2 |
| Hamden: | 29.3 |
| Madison: | 37.0 |
 The median response time based on all reported fire incidents is 5 minutes. This is comparable to the Connecticut median value.
The median response time in Branford, CT compared to nearest cities:
(Note: Based on data for all years, including only cities with at least 500 fire incidents)
| Branford: | 5 minutes |
| East Haven: | 4 minutes |
| North Branford: | 6 minutes |
| Guilford: | 5 minutes |
| New Haven: | 4 minutes |
| North Haven: | 6 minutes |
| West Haven: | 4 minutes |
| Hamden: | 4 minutes |
| Madison: | 6 minutes |
 According to the data from the years 2002 - 2018 the average number of fire-related casualties per year is 1. The highest number of reported injuries - 3 took place in 2007, and the lowest - 0 in 2002. The data has a rising trend.
The average number of injuries per 1,000 fire incidents is 15. This indicator was the highest - 50 in 2018, and the lowest 0 in 2002. The trend for casualties per 1,000 fires is growing. Compared to the Connecticut value the number of casualties per 1,000 fires is higher.
According to the data from the years 2002 - 2018 the average number of fire-related casualties per year is 1. The highest number of reported injuries - 3 took place in 2007, and the lowest - 0 in 2002. The data has a rising trend.
The average number of injuries per 1,000 fire incidents is 15. This indicator was the highest - 50 in 2018, and the lowest 0 in 2002. The trend for casualties per 1,000 fires is growing. Compared to the Connecticut value the number of casualties per 1,000 fires is higher.Casualties per 1,000 incidents in Branford, CT compared to nearest cities:
(Note: Based on data for all years, including only cities with at least 500 fire incidents)
| Branford: | 18.7 |
| East Haven: | 23.6 |
| North Branford: | 20.1 |
| Guilford: | 6.8 |
| New Haven: | 2.7 |
| North Haven: | 14.9 |
| West Haven: | 13.6 |
| Hamden: | 15.1 |
| Madison: | 14.6 |
 31.0% incidents where reported in the morning and 69.0% in the evening. The most fires (17.4%) took place on Thursday, and the least (12.2%) on Wednesday.
 According to the 965 fires from years 2002 - 2018 most fires (11.6%) took place during April, and the least (5.6%) in November.
 Out of all 24,243 cases reported during the years 2002 - 2018, the most belonged to the categories: Rescue & EMS (68.8%), Service Call (8.7%), and Hazardous Condition (7.4%).
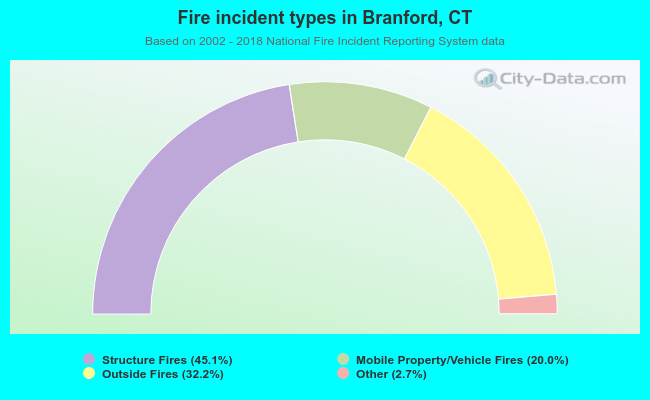 When looking into fire subcategories, the most reports belonged to: Structure Fires (45.1%), and Outside Fires (32.2%).