Hamden: Fire Incidents, Connecticut (CT)
Where are fire incidents reported in Hamden, CT
Something went wrong! Please refresh the page.
| Fire incidents reported | |
|---|---|
| Sreet name | Count |
| DIXWELL AVE | 1,036 |
| WHITNEY AVE | 520 |
| MIX AVE | 212 |
| PINE ROCK AVE | 184 |
| STATE ST | 164 |
| PUTNAM AVE | 120 |
| MT CARMEL AVE | 106 |
| SHEPARD AVE | 106 |
| CIRCULAR AVE | 100 |
| SHERMAN AVE | 96 |
| WINTERGREEN AVE | 90 |
| LEEDER HILL DR | 74 |
| TREADWELL ST | 64 |
| HELEN ST | 62 |
| MORSE ST | 62 |
| ASPEN GLEN DR | 60 |
| EVERGREEN AVE | 60 |
| NEWHALL ST | 60 |
| KAYE VUE DR | 58 |
| SKIFF ST | 58 |
| DUNBAR HILL RD | 50 |
| PARADISE AVE | 50 |
| TOWN WALK DR | 44 |
| WASHINGTON AVE | 44 |
| WEST WOODS RD | 44 |
| WOODIN ST | 44 |
| GOODRICH ST | 42 |
| MILL ROCK RD | 42 |
| TOWNE HOUSE RD | 42 |
| BENHAM ST | 40 |
| Other | 111 |
2002 - 2018 National Fire Incident Reporting System (NFIRS) incidents
- Incident types reported to NFIRS in Hamden, CT
- 37,83963.2%Rescue & EMS
- 5,8589.8%Hazardous Condition
- 4,9608.3%Service Call
- 4,6617.8%False Alarm
- 3,8456.4%Fire
- 2,5644.3%Good Intent Call
- 870.1%Severe Weather
- 620.1%Overpressure Rupture
- Fire incident types reported to NFIRS in Hamden, CT
- 2,06153.6%Structure Fires
- 1,22131.8%Outside Fires
- 46312.0%Mobile Property/Vehicle Fires
- 1002.6%Other
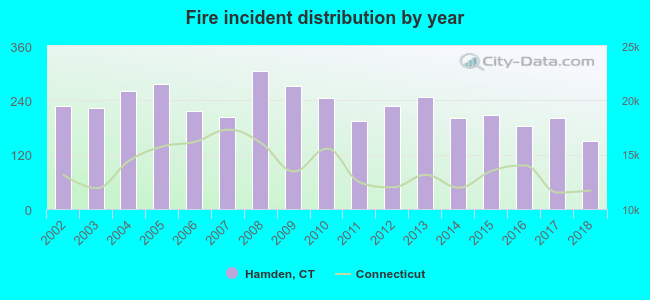 According to the data from the years 2002 - 2018 the average number of fires per year is 226. The highest number of fire incidents - 304 took place in 2008, and the least - 151 in 2018. The data has a decreasing trend.
The average number of yearly fire incidents per 10k residents in Hamden, CT compared to nearest cities:
(Note: Based on data for the last 3 years, including only cities with population 5,000 and above)
| Hamden: | 29.3 |
| North Haven: | 56.3 |
| New Haven: | 29.0 |
| Woodbridge: | 51.2 |
| Bethany: | 11.4 |
| East Haven: | 30.2 |
| West Haven: | 47.2 |
| North Branford: | 19.0 |
| Wallingford: | 27.8 |
 The median response time based on all reported fire incidents is 4 minutes. This is lower compared to the state median value.
The median response time in Hamden, CT compared to nearest cities:
(Note: Based on data for all years, including only cities with at least 500 fire incidents)
| Hamden: | 4 minutes |
| North Haven: | 6 minutes |
| New Haven: | 4 minutes |
| East Haven: | 4 minutes |
| West Haven: | 4 minutes |
| North Branford: | 6 minutes |
| Wallingford: | 6 minutes |
| Ansonia: | 4 minutes |
| Seymour: | 5 minutes |
 According to the reports from the years 2002 - 2018 the average number of fire-related fatalities per year is 0. The highest number of deaths - 2 took place in 2014, and the lowest - 0 in 2004. The data has a dropping trend.
The average number of fatalities per 1,000 fire incidents is 2. This indicator was the highest - 10 in 2014, and the lowest 0 in 2004. The trend for fatalities per 1,000 incidents is declining. Compared to the Connecticut value the number of fatalities per 1,000 fires is higher.
According to the reports from the years 2002 - 2018 the average number of fire-related fatalities per year is 0. The highest number of deaths - 2 took place in 2014, and the lowest - 0 in 2004. The data has a dropping trend.
The average number of fatalities per 1,000 fire incidents is 2. This indicator was the highest - 10 in 2014, and the lowest 0 in 2004. The trend for fatalities per 1,000 incidents is declining. Compared to the Connecticut value the number of fatalities per 1,000 fires is higher.Deaths per 1,000 incidents in Hamden, CT compared to nearest cities:
(Note: Based on data for all years, including only cities with at least 2,500 fire incidents)
| Hamden: | 2.1 |
| New Haven: | 1.6 |
| West Haven: | 2.1 |
| Wallingford: | 2.2 |
| Meriden: | 1.6 |
| Waterbury: | 0.7 |
| Stratford: | 2.7 |
| Middletown: | 0.9 |
| Bridgeport: | 2.5 |
 Based on the reports from the years 2002 - 2018 the average number of fire-related yearly casualties is 3. The highest number of injuries - 8 took place in 2014, and the lowest - 0 in 2018. The data has a decreasing trend.
The average number of casualties per 1,000 fires is 15. This indicator was the highest - 40 in 2014, and the lowest 0 in 2018. The trend for casualties per 1,000 fire incidents is declining. Compared to the Connecticut value the number of casualties per 1,000 fires is higher.
Based on the reports from the years 2002 - 2018 the average number of fire-related yearly casualties is 3. The highest number of injuries - 8 took place in 2014, and the lowest - 0 in 2018. The data has a decreasing trend.
The average number of casualties per 1,000 fires is 15. This indicator was the highest - 40 in 2014, and the lowest 0 in 2018. The trend for casualties per 1,000 fire incidents is declining. Compared to the Connecticut value the number of casualties per 1,000 fires is higher.Casualties per 1,000 incidents in Hamden, CT compared to nearest cities:
(Note: Based on data for all years, including only cities with at least 500 fire incidents)
| Hamden: | 15.1 |
| North Haven: | 14.9 |
| New Haven: | 2.7 |
| East Haven: | 23.6 |
| West Haven: | 13.6 |
| North Branford: | 20.1 |
| Wallingford: | 14.4 |
| Ansonia: | 16.2 |
| Seymour: | 10.7 |
 27.9% incidents where reported in the morning and 72.1% in the evening. The most fires (15.3%) took place on Sunday, and the least (13.3%) on Monday.
 According to the 3,845 incident reports from years 2002 - 2018 most fires (11.0%) took place during April, and the least (7.0%) in November.
 Out of all 59,893 cases reported during the years 2002 - 2018, the most belonged to the categories: Rescue & EMS (63.2%), Hazardous Condition (9.8%), and Service Call (8.3%).
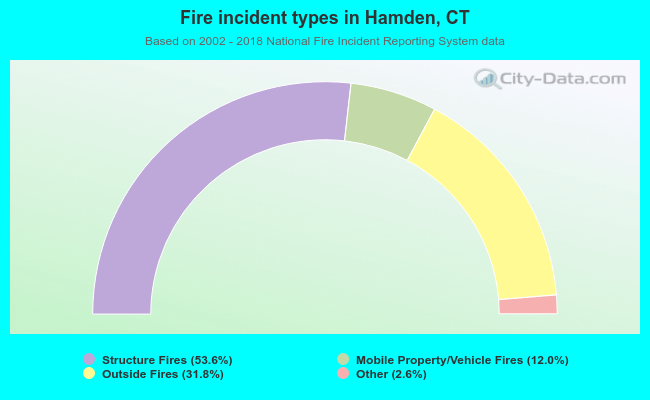 When looking into fire subcategories, the most incidents belonged to: Structure Fires (53.6%), and Outside Fires (31.8%).