Meriden: Fire Incidents, Connecticut (CT)
Where are fire incidents reported in Meriden, CT
Something went wrong! Please refresh the page.
| Fire incidents reported | |
|---|---|
| Sreet name | Count |
| MAIN ST | 426 |
| BROAD ST | 404 |
| E MAIN ST | 246 |
| CROWN ST | 190 |
| W MAIN ST | 174 |
| LEWIS AVE | 154 |
| COLONY ST | 148 |
| CENTER ST | 140 |
| WILLOW ST | 134 |
| COOK AVE | 120 |
| BRITANNIA ST | 110 |
| HANOVER ST | 110 |
| S BROAD ST | 102 |
| OLD COLONY RD | 100 |
| PRATT ST | 96 |
| SHERMAN AVE | 92 |
| N BROAD ST | 86 |
| CEDAR ST | 82 |
| LIBERTY ST | 80 |
| WESTFIELD RD | 80 |
| GRAVEL ST | 76 |
| MILL ST | 72 |
| BEE ST | 68 |
| CHAMBERLAIN HWY | 66 |
| STATE ST | 64 |
| CAMP ST | 62 |
| PADDOCK AVE | 62 |
| I91 N&S WLF-MLDTWN | 56 |
| SPRINGDALE AVE | 56 |
| RANDOLPH AVE | 52 |
| Other | 762 |
2002 - 2018 National Fire Incident Reporting System (NFIRS) incidents
- Incident types reported to NFIRS in Meriden, CT
- 29,10049.6%Rescue & EMS
- 10,91018.6%Hazardous Condition
- 5,3109.1%Good Intent Call
- 4,5757.8%False Alarm
- 4,4707.6%Fire
- 4,2017.2%Service Call
- 600.1%Overpressure Rupture
- Fire incident types reported to NFIRS in Meriden, CT
- 1,96644.0%Structure Fires
- 1,49633.5%Outside Fires
- 76717.2%Mobile Property/Vehicle Fires
- 2415.4%Other
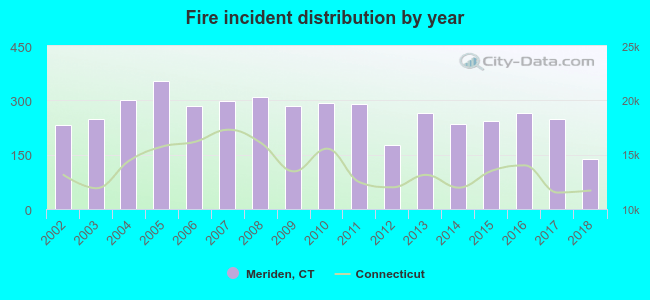 According to the data from the years 2002 - 2018 the average number of fires per year is 263. The highest number of reported fires - 354 took place in 2005, and the least - 139 in 2018. The data has a dropping trend.
The average number of yearly fire incidents per 10k residents in Meriden, CT compared to nearest cities:
(Note: Based on data for the last 3 years, including only cities with population 5,000 and above)
| Meriden: | 36.2 |
| Wallingford: | 27.8 |
| Cheshire: | 23.0 |
| Southington: | 21.6 |
| Berlin: | 15.6 |
| Middletown: | 37.9 |
| Cromwell: | 27.8 |
| Prospect: | 14.9 |
| Portland: | 59.1 |
 The median response time based on all reported fire incidents is 4 minutes. This is lower compared to the state median value.
The median response time in Meriden, CT compared to nearest cities:
(Note: Based on data for all years, including only cities with at least 500 fire incidents)
| Meriden: | 4 minutes |
| Wallingford: | 6 minutes |
| Cheshire: | 5 minutes |
| Southington: | 6 minutes |
| Berlin: | 6 minutes |
| Middletown: | 5 minutes |
| Cromwell: | 7 minutes |
| Portland: | 5 minutes |
| New Britain: | 4 minutes |
 Based on the reports from the years 2002 - 2018 the average number of fire-related fatalities per year is 0. The highest number of reported deaths - 3 took place in 2010, and the lowest - 0 in 2002. The data has a constant trend.
The average number of deaths per 1,000 fires is 1. This indicator was the highest - 10 in 2010, and the lowest 0 in 2002. The trend for deaths per 1,000 fires is constant. Compared to the state value the number of deaths per 1,000 fires is similar.
Based on the reports from the years 2002 - 2018 the average number of fire-related fatalities per year is 0. The highest number of reported deaths - 3 took place in 2010, and the lowest - 0 in 2002. The data has a constant trend.
The average number of deaths per 1,000 fires is 1. This indicator was the highest - 10 in 2010, and the lowest 0 in 2002. The trend for deaths per 1,000 fires is constant. Compared to the state value the number of deaths per 1,000 fires is similar.Deaths per 1,000 incidents in Meriden, CT compared to nearest cities:
(Note: Based on data for all years, including only cities with at least 2,500 fire incidents)
| Meriden: | 1.6 |
| Wallingford: | 2.2 |
| Middletown: | 0.9 |
| New Britain: | 1.2 |
| Bristol: | 1.5 |
| Waterbury: | 0.7 |
| Hamden: | 2.1 |
| West Hartford: | 1.6 |
| New Haven: | 1.6 |
 According to the reports from the years 2002 - 2018 the average number of fire-related casualties per year is 3. The highest number of reported injuries - 9 took place in 2007, and the lowest - 0 in 2012. The data has a decreasing trend.
The average number of casualties per 1,000 fires is 12. This indicator was the highest - 30 in 2007, and the lowest 0 in 2012. The trend for injuries per 1,000 fires is declining. Compared to the state value the number of injuries per 1,000 fire incidents is about the same.
According to the reports from the years 2002 - 2018 the average number of fire-related casualties per year is 3. The highest number of reported injuries - 9 took place in 2007, and the lowest - 0 in 2012. The data has a decreasing trend.
The average number of casualties per 1,000 fires is 12. This indicator was the highest - 30 in 2007, and the lowest 0 in 2012. The trend for injuries per 1,000 fires is declining. Compared to the state value the number of injuries per 1,000 fire incidents is about the same.Casualties per 1,000 incidents in Meriden, CT compared to nearest cities:
(Note: Based on data for all years, including only cities with at least 500 fire incidents)
| Meriden: | 12.3 |
| Wallingford: | 14.4 |
| Cheshire: | 13.2 |
| Southington: | 23.5 |
| Berlin: | 10.8 |
| Middletown: | 8.3 |
| Cromwell: | 5.4 |
| Portland: | 0.0 |
| New Britain: | 21.0 |
 28.5% incidents where reported in the morning and 71.5% in the evening. The most fires (16.1%) took place on Sunday, and the least (12.9%) on Thursday.
 According to the 4,470 fires from years 2002 - 2018 most fires (10.3%) took place during April, and the least (6.7%) in January.
 Out of all 58,668 cases reported during the years 2002 - 2018, the most belonged to the categories: Rescue & EMS (49.6%), Hazardous Condition (18.6%), and Good Intent Call (9.1%).
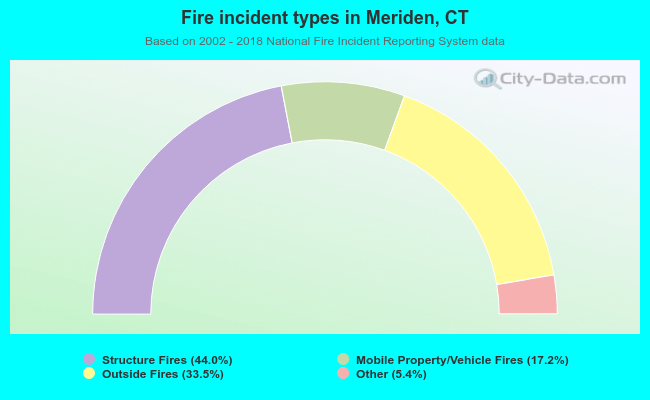 When looking into fire subcategories, the most reports belonged to: Structure Fires (44.0%), and Outside Fires (33.5%).