Bristol: Fire Incidents, Connecticut (CT)
Where are fire incidents reported in Bristol, CT
Something went wrong! Please refresh the page.
| Fire incidents reported | |
|---|---|
| Sreet name | Count |
| FARMINGTON AVE | 354 |
| MAIN ST | 302 |
| PINE ST | 136 |
| STAFFORD AVE | 134 |
| DAVIS DR | 124 |
| GAYLORD ST | 118 |
| EMMETT ST | 112 |
| WASHINGTON ST | 92 |
| JEROME AVE | 84 |
| WEST ST | 82 |
| BLAKESLEE ST | 80 |
| BROAD ST | 78 |
| BURLINGTON AVE | 76 |
| MIDDLE ST | 74 |
| TERRYVILLE AVE | 74 |
| LAKE AVE | 70 |
| PARK ST | 70 |
| JACOBS ST | 66 |
| RIVERSIDE AVE | 64 |
| SOUTH ST | 62 |
| REDSTONE HILL RD | 60 |
| SUMMER ST | 58 |
| WOLCOTT ST | 56 |
| PROSPECT ST | 54 |
| LILLIAN RD | 50 |
| SHAWN DR | 44 |
| DIVINITY ST | 42 |
| MATTHEWS ST | 42 |
| TERRYVILLE RD | 42 |
| BIRCH ST | 40 |
| Other | 544 |
2004 - 2018 National Fire Incident Reporting System (NFIRS) incidents
- Incident types reported to NFIRS in Bristol, CT
- 11,19051.1%Hazardous Condition
- 3,28415.0%Fire
- 3,13014.3%Service Call
- 1,8898.6%False Alarm
- 1,2835.9%Rescue & EMS
- 1,0794.9%Good Intent Call
- 230.1%Overpressure Rupture
- Fire incident types reported to NFIRS in Bristol, CT
- 1,78954.5%Structure Fires
- 1,02031.1%Outside Fires
- 39912.1%Mobile Property/Vehicle Fires
- 762.3%Other
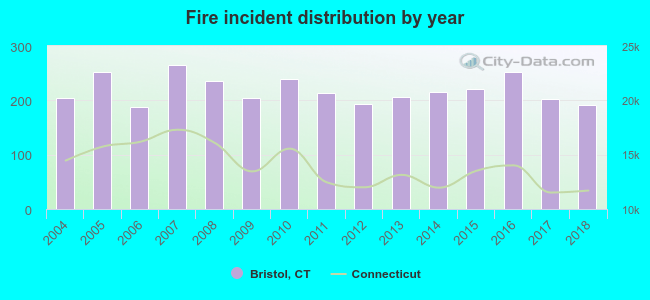 Based on the data from the years 2004 - 2018 the average number of fires per year is 219. The highest number of fires - 265 took place in 2007, and the least - 188 in 2006. The data has a declining trend.
The average number of yearly fire incidents per 10k residents in Bristol, CT compared to nearest cities:
(Note: Based on data for the last 3 years, including only cities with population 5,000 and above)
| Bristol: | 35.6 |
| Terryville: | 26.0 |
| Plainville: | 43.1 |
| Plymouth: | 3.7 |
| Burlington: | 28.7 |
| Farmington: | 22.1 |
| Southington: | 21.6 |
| Wolcott: | 22.2 |
| Thomaston: | 23.2 |
 The median response time based on all reported fire incidents is 4 minutes. This is lower than the state median value.
The median response time in Bristol, CT compared to nearest cities:
(Note: Based on data for all years, including only cities with at least 500 fire incidents)
| Bristol: | 4 minutes |
| Plainville: | 5 minutes |
| Farmington: | 7 minutes |
| Southington: | 6 minutes |
| Wolcott: | 5 minutes |
| New Britain: | 4 minutes |
| Avon: | 7 minutes |
| Harwinton: | 7 minutes |
| Berlin: | 6 minutes |
 Based on the data from the years 2004 - 2018 the average number of fire-related casualties per year is 6. The highest number of reported injuries - 12 took place in 2006, and the lowest - 1 in 2012. The data has a constant trend.
The average number of injuries per 1,000 fire incidents is 26. This indicator was the highest - 64 in 2006, and the lowest 5 in 2012. The trend for casualties per 1,000 incidents is growing. Compared to the Connecticut value the number of injuries per 1,000 incidents is much higher.
Based on the data from the years 2004 - 2018 the average number of fire-related casualties per year is 6. The highest number of reported injuries - 12 took place in 2006, and the lowest - 1 in 2012. The data has a constant trend.
The average number of injuries per 1,000 fire incidents is 26. This indicator was the highest - 64 in 2006, and the lowest 5 in 2012. The trend for casualties per 1,000 incidents is growing. Compared to the Connecticut value the number of injuries per 1,000 incidents is much higher.Casualties per 1,000 incidents in Bristol, CT compared to nearest cities:
(Note: Based on data for all years, including only cities with at least 500 fire incidents)
| Bristol: | 25.9 |
| Plainville: | 31.2 |
| Farmington: | 17.2 |
| Southington: | 23.5 |
| Wolcott: | 5.0 |
| New Britain: | 21.0 |
| Avon: | 7.6 |
| Harwinton: | 0.0 |
| Berlin: | 10.8 |
 29.3% incidents where reported in the morning and 70.7% in the evening. The most fires (14.8%) took place on Monday, and the least (13.4%) on Wednesday.
 According to the 3,284 reports from years 2004 - 2018 most fires (10.4%) took place during November, and the least (7.0%) in February.
 Out of all 21,899 cases reported during the years 2004 - 2018, the most belonged to the categories: Hazardous Condition (51.1%), Fire (15.0%), and Service Call (14.3%).
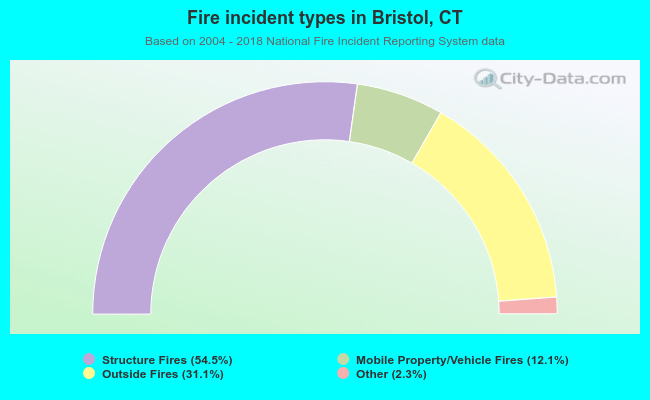 When looking into fire subcategories, the most incidents belonged to: Structure Fires (54.5%), and Outside Fires (31.1%).