Southington: Fire Incidents, Connecticut (CT)
Where are fire incidents reported in Southington, CT
Something went wrong! Please refresh the page.
| Fire incidents reported | |
|---|---|
| Sreet name | Count |
| QUEEN ST | 188 |
| QUEEN ST | 144 |
| MERIDEN WATERBURY RD | 78 |
| MOUNT VERNON RD | 72 |
| MOUNT VERNON RD | 70 |
| MERIDEN WATERBURY TPKE | 68 |
| I-84 WB | 64 |
| WEST ST | 62 |
| I84 WB | 58 |
| MAIN ST | 58 |
| MAIN ST | 58 |
| DARLING ST | 56 |
| I84 EB | 56 |
| I-84 EB | 52 |
| PLEASANT ST | 48 |
| DARLING ST | 46 |
| WEST ST | 46 |
| NORTH MAIN ST | 40 |
| OLD TURNPIKE RD | 36 |
| ANDREWS ST | 32 |
| FLANDERS RD | 30 |
| NORTH MAIN ST | 30 |
| MERIDEN AV | 28 |
| MERIDEN AV | 28 |
| MERIDEN WATERBURY RD | 28 |
| WEST CENTER ST | 26 |
| OLD TURNPIKE RD | 24 |
| PLEASANT ST | 24 |
| ANDREWS ST | 22 |
| FLANDERS RD | 22 |
| Other | 406 |
2002 - 2018 National Fire Incident Reporting System (NFIRS) incidents
- Incident types reported to NFIRS in Southington, CT
- 5,23832.6%Hazardous Condition
- 3,30220.6%Service Call
- 2,20813.7%Rescue & EMS
- 2,00012.5%Fire
- 1,90411.9%False Alarm
- 1,3508.4%Good Intent Call
- 280.2%Special Incident
- Fire incident types reported to NFIRS in Southington, CT
- 79039.5%Outside Fires
- 71435.7%Structure Fires
- 43421.7%Mobile Property/Vehicle Fires
- 623.1%Other
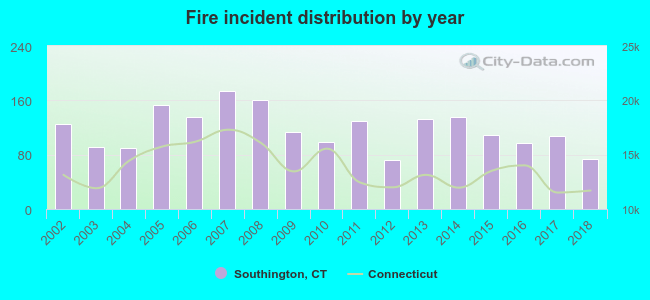 Based on the data from the years 2002 - 2018 the average number of fires per year is 118. The highest number of reported fire incidents - 174 took place in 2007, and the least - 72 in 2012. The data has a decreasing trend.
The average number of yearly fire incidents per 10k residents in Southington, CT compared to nearest cities:
(Note: Based on data for the last 3 years, including only cities with population 5,000 and above)
| Southington: | 21.6 |
| Plainville: | 43.1 |
| Wolcott: | 22.2 |
| Berlin: | 15.6 |
| Meriden: | 36.2 |
| Bristol: | 35.6 |
| Cheshire: | 23.0 |
| New Britain: | 45.7 |
| Terryville: | 26.0 |
 The median response time based on all reported fire incidents is 6 minutes. This is about the same as the state median value.
The median response time in Southington, CT compared to nearest cities:
(Note: Based on data for all years, including only cities with at least 500 fire incidents)
| Southington: | 6 minutes |
| Plainville: | 5 minutes |
| Wolcott: | 5 minutes |
| Berlin: | 6 minutes |
| Meriden: | 4 minutes |
| Bristol: | 4 minutes |
| Cheshire: | 5 minutes |
| New Britain: | 4 minutes |
| Waterbury: | 4 minutes |
 According to the data from the years 2002 - 2018 the average number of fire-related casualties per year is 3. The highest number of reported casualties - 6 took place in 2007, and the lowest - 0 in 2012. The data has a constant trend.
The average number of injuries per 1,000 fires is 23. This indicator was the highest - 46 in 2015, and the lowest 0 in 2012. The trend for injuries per 1,000 incidents is growing. Compared to the Connecticut value the number of casualties per 1,000 fires is higher.
According to the data from the years 2002 - 2018 the average number of fire-related casualties per year is 3. The highest number of reported casualties - 6 took place in 2007, and the lowest - 0 in 2012. The data has a constant trend.
The average number of injuries per 1,000 fires is 23. This indicator was the highest - 46 in 2015, and the lowest 0 in 2012. The trend for injuries per 1,000 incidents is growing. Compared to the Connecticut value the number of casualties per 1,000 fires is higher.Casualties per 1,000 incidents in Southington, CT compared to nearest cities:
(Note: Based on data for all years, including only cities with at least 500 fire incidents)
| Southington: | 23.5 |
| Plainville: | 31.2 |
| Wolcott: | 5.0 |
| Berlin: | 10.8 |
| Meriden: | 12.3 |
| Bristol: | 25.9 |
| Cheshire: | 13.2 |
| New Britain: | 21.0 |
| Waterbury: | 13.0 |
 28.5% incidents where reported in the morning and 71.5% in the evening. The most fires (16.3%) took place on Saturday, and the least (12.7%) on Tuesday.
 According to the 2,000 reports from years 2002 - 2018 most fires (11.5%) took place during April, and the least (5.7%) in February.
 Out of all 16,061 cases reported during the years 2002 - 2018, the most belonged to the categories: Hazardous Condition (32.6%), Service Call (20.6%), and Rescue & EMS (13.7%).
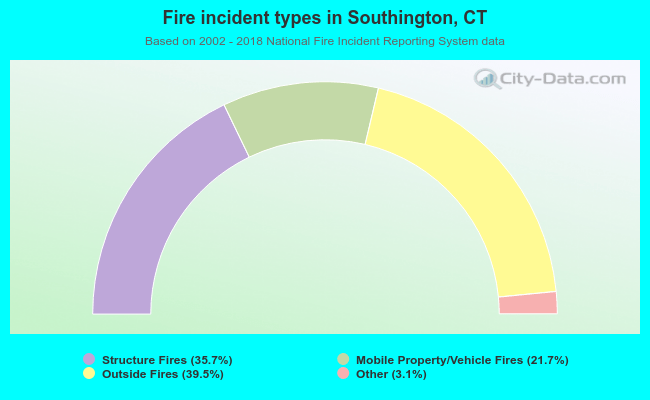 When looking into fire subcategories, the most reports belonged to: Outside Fires (39.5%), and Structure Fires (35.7%).