Prospect: Fire Incidents, Connecticut (CT)
Where are fire incidents reported in Prospect, CT
Something went wrong! Please refresh the page.
|
| |||||||||||||||||||||||||||||||||||||||||||||||||||||||||||||||||||||||||||||||||||||||||||||||||||||||||||||
2002 - 2018 National Fire Incident Reporting System (NFIRS) incidents
- Incident types reported to NFIRS in Prospect, CT
- 2,48553.2%Rescue & EMS
- 96220.6%Hazardous Condition
- 4359.3%False Alarm
- 3146.7%Fire
- 2595.5%Service Call
- 2084.5%Good Intent Call
- Fire incident types reported to NFIRS in Prospect, CT
- 12740.4%Structure Fires
- 8226.1%Mobile Property/Vehicle Fires
- 7423.6%Outside Fires
- 319.9%Other
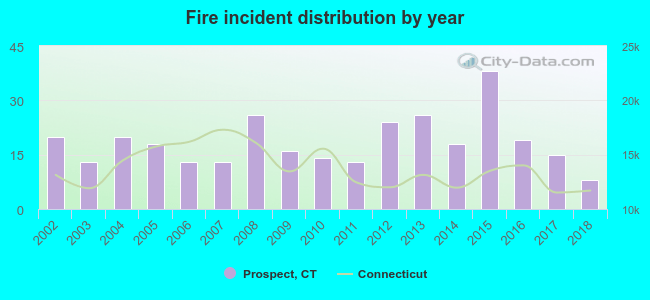 According to the data from the years 2002 - 2018 the average number of fire incidents per year is 18. The highest number of fire incidents - 38 took place in 2015, and the least - 8 in 2018. The data has a dropping trend.
The average number of yearly fire incidents per 10k residents in Prospect, CT compared to nearest cities:
(Note: Based on data for the last 3 years, including only cities with population 5,000 and above)
| Prospect: | 14.9 |
| Cheshire: | 23.0 |
| Naugatuck: | 31.4 |
| Waterbury: | 51.4 |
| Bethany: | 11.4 |
| Beacon Falls: | 40.8 |
| Wolcott: | 22.2 |
| Middlebury: | 29.0 |
| Oakville: | 21.0 |

 According to the reports from the years 2002 - 2018 the average number of fire-related casualties per year is 0. The highest number of injuries - 4 took place in 2015, and the lowest - 0 in 2002. The data has a constant trend.
 37.3% incidents where reported in the morning and 62.7% in the evening. The most fires (18.8%) took place on Saturday, and the least (9.6%) on Monday.
 Based on the 314 reports from years 2002 - 2018 most fires (12.1%) took place during April, and the least (5.4%) in October.
 Out of all 4,668 cases reported during the years 2002 - 2018, the most belonged to the categories: Overpressure Rupture (53.2%), Rescue & EMS (20.6%), and Good Intent Call (9.3%).
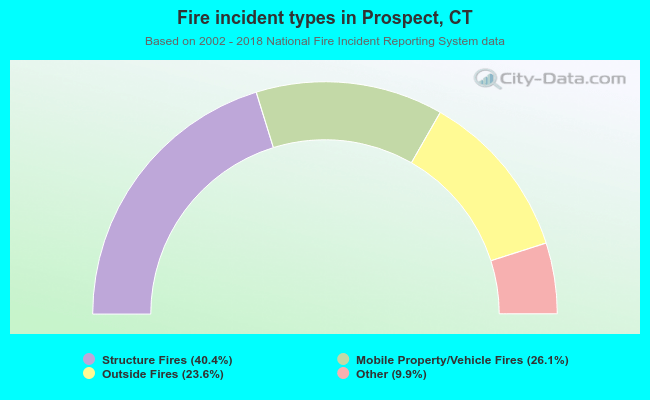 When looking into fire subcategories, the most reports belonged to: Structure Fires (40.4%), and Mobile Property/Vehicle Fires (26.1%).