Orangevale: Fire Incidents, California (CA)
Where are fire incidents reported in Orangevale, CA
Something went wrong! Please refresh the page.
| Fire incidents reported | |
|---|---|
| Sreet name | Count |
| GREENBACK LN | 190 |
| MAIN AV | 48 |
| BEECH AV | 30 |
| ALMOND AV | 28 |
| HAZEL AV | 28 |
| FILBERT AV | 24 |
| ELM AV | 22 |
| MAIN | 22 |
| CENTRAL | 18 |
| CENTRAL AV | 18 |
| LAKE NATOMA DR | 16 |
| OAK AV | 16 |
| BEECH | 14 |
| CHESTNUT | 14 |
| FILBERT | 14 |
| MADISON AV | 12 |
| ARP | 10 |
| HOFFMAN LN | 10 |
| ILLINOIS AV | 10 |
| PERSHING AV | 10 |
| WALNUT AV | 10 |
| ALMOND | 8 |
| ELM | 8 |
| FOXFIRE DR | 8 |
| HAZEL | 8 |
| KENNETH | 8 |
| MADISON | 8 |
| MISSISSIPPI BAR DR | 8 |
| OLD ORCHARD WY | 8 |
| SANTA JUANITA AV | 8 |
2005 - 2018 National Fire Incident Reporting System (NFIRS) incidents
- Incident types reported to NFIRS in Orangevale, CA
- 7,84469.9%Rescue & EMS
- 1,0869.7%Good Intent Call
- 9858.8%Service Call
- 5845.2%Fire
- 3613.2%False Alarm
- 3052.7%Hazardous Condition
- 450.4%Special Incident
- Fire incident types reported to NFIRS in Orangevale, CA
- 31153.3%Outside Fires
- 15827.1%Structure Fires
- 6110.4%Mobile Property/Vehicle Fires
- 549.2%Other
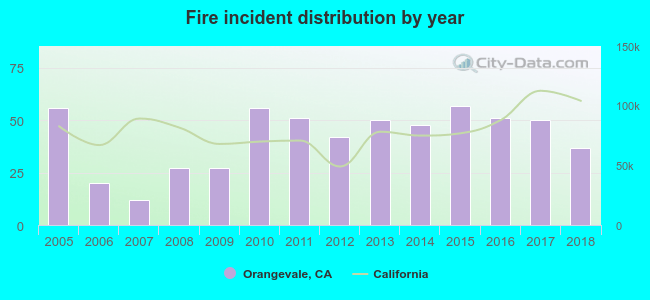 According to the data from the years 2005 - 2018 the average number of fire incidents per year is 42. The highest number of fires - 57 took place in 2015, and the least - 12 in 2007. The data has a declining trend.
The average number of yearly fire incidents per 10k residents in Orangevale, CA compared to nearest cities:
(Note: Based on data for the last 3 years, including only cities with population 5,000 and above)
| Orangevale: | 13.5 |
| Folsom: | 7.3 |
| Fair Oaks: | 14.0 |
| Citrus Heights: | 28.1 |
| Gold River: | 2.5 |
| Granite Bay: | 28.4 |
| Roseville: | 22.8 |
| Antelope: | 11.7 |
| Carmichael: | 16.0 |
 The median response time based on all reported fire incidents is 5 minutes. This is lower than the state median value.
The median response time in Orangevale, CA compared to nearest cities:
(Note: Based on data for all years, including only cities with at least 500 fire incidents)
| Orangevale: | 5 minutes |
| Fair Oaks: | 5 minutes |
| Citrus Heights: | 5 minutes |
| Granite Bay: | 7 minutes |
| Roseville: | 5 minutes |
| Antelope: | 5 minutes |
| Carmichael: | 5 minutes |
| El Dorado Hills: | 6 minutes |
| Rancho Cordova: | 5 minutes |
 33.4% incidents where reported in the morning and 66.6% in the evening. The most fires (18.8%) took place on Saturday, and the least (12.0%) on Wednesday.
 According to the 584 reports from years 2005 - 2018 most fires (14.9%) took place during July, and the least (5.5%) in March.
 Out of all 11,219 cases reported during the years 2005 - 2018, the most belonged to the categories: Rescue & EMS (69.9%), Good Intent Call (9.7%), and Service Call (8.8%).
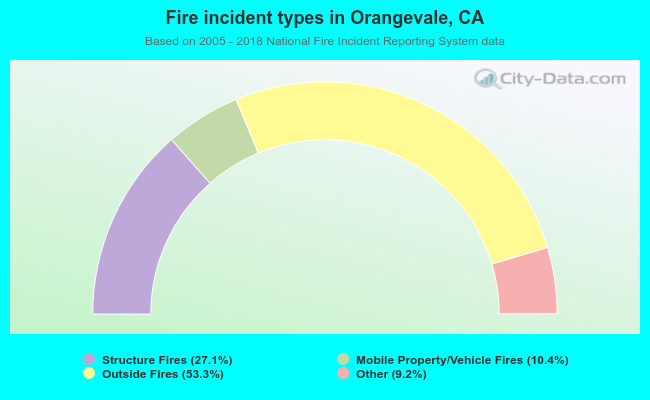 When looking into fire subcategories, the most reports belonged to: Outside Fires (53.3%), and Structure Fires (27.1%).