Granite Bay: Fire Incidents, California (CA)
Where are fire incidents reported in Granite Bay, CA
Something went wrong! Please refresh the page.
|
| |||||||||||||||||||||||||||||||||||||||||||||||||||||||||||||||||||||||||||||||||||||||||||||||||||||||||||||
2005 - 2018 National Fire Incident Reporting System (NFIRS) incidents
- Incident types reported to NFIRS in Granite Bay, CA
- 4,24163.0%Rescue & EMS
- 6219.2%Good Intent Call
- 5688.4%Service Call
- 5468.1%Fire
- 3715.5%False Alarm
- 3605.3%Hazardous Condition
- 150.2%Overpressure Rupture
- Fire incident types reported to NFIRS in Granite Bay, CA
- 27049.5%Outside Fires
- 19635.9%Structure Fires
- 549.9%Mobile Property/Vehicle Fires
- 264.8%Other
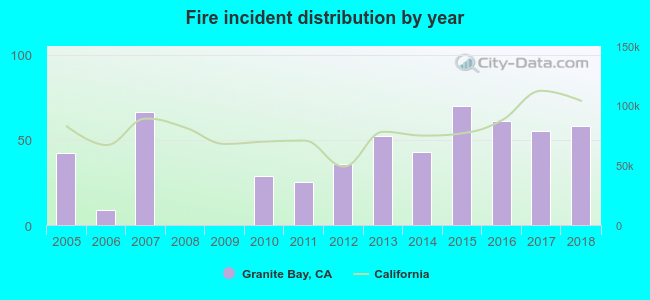 According to the data from the years 2005 - 2018 the average number of fires per year is 39. The highest number of fires - 70 took place in 2015, and the least - 0 in 2008. The data has a rising trend.
The average number of yearly fire incidents per 10k residents in Granite Bay, CA compared to nearest cities:
(Note: Based on data for the last 3 years, including only cities with population 5,000 and above)
| Granite Bay: | 28.4 |
| Loomis: | 98.1 |
| Orangevale: | 13.5 |
| Rocklin: | 17.7 |
| Folsom: | 7.3 |
| Roseville: | 22.8 |
| El Dorado Hills: | 24.3 |
| Citrus Heights: | 28.1 |
| Fair Oaks: | 14.0 |
 The median response time based on all reported fire incidents is 7 minutes. This is close to the state median value.
The median response time in Granite Bay, CA compared to nearest cities:
(Note: Based on data for all years, including only cities with at least 500 fire incidents)
| Granite Bay: | 7 minutes |
| Loomis: | 8 minutes |
| Orangevale: | 5 minutes |
| Rocklin: | 6 minutes |
| Roseville: | 5 minutes |
| El Dorado Hills: | 6 minutes |
| Citrus Heights: | 5 minutes |
| Fair Oaks: | 5 minutes |
| Antelope: | 5 minutes |
 28.9% incidents where reported in the morning and 71.1% in the evening. The most fires (16.1%) took place on Thursday, and the least (12.6%) on Wednesday.
 According to the 546 fires from years 2005 - 2018 most fires (19.4%) took place during July, and the least (3.8%) in April.
 Out of all 6,732 cases reported during the years 2005 - 2018, the most belonged to the categories: Rescue & EMS (63.0%), Good Intent Call (9.2%), and Service Call (8.4%).
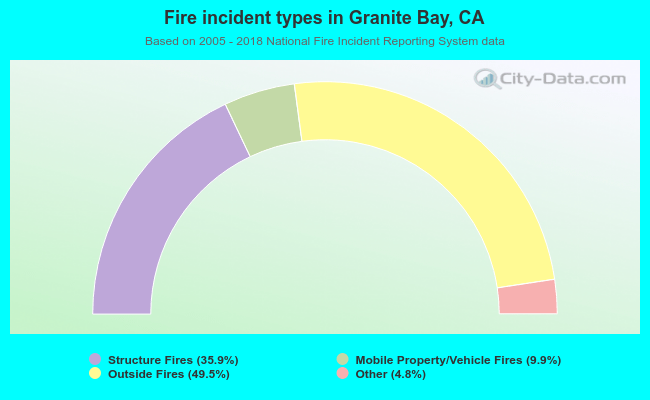 When looking into fire subcategories, the most incidents belonged to: Outside Fires (49.5%), and Structure Fires (35.9%).