El Dorado Hills: Fire Incidents, California (CA)
Where are fire incidents reported in El Dorado Hills, CA
Something went wrong! Please refresh the page.
| Fire incidents reported | |
|---|---|
| Sreet name | Count |
| FRANCISCO DR | 58 |
| GREEN VALLEY RD | 46 |
| US HWY 50 | 42 |
| PARK DR | 32 |
| BEATTY DR | 30 |
| EL DORADO HILLS BLVD | 30 |
| TOWN CENTER BLVD | 28 |
| VALLEY VIEW PKY | 28 |
| BASS LAKE RD | 22 |
| ABERDEEN LN | 20 |
| POWERS DR | 20 |
| HARVARD WAY | 18 |
| SERRANO PKY | 18 |
| SILVA VALLEY PKY | 18 |
| ROBERT J MATHEWS PKY | 16 |
| WILSON BLVD | 16 |
| ORBETELLO WAY | 14 |
| TERRACINA DR | 14 |
| LATROBE RD | 12 |
| RIDGEVIEW DR | 12 |
| SALMON FALLS RD | 12 |
| WHITE ROCK RD | 12 |
| GARLENDA DR | 10 |
| GREENVIEW DR | 10 |
| MONTRIDGE WAY | 10 |
| OLSON LN | 10 |
| BECKETT DR | 8 |
| BREESE CIR | 8 |
| CONCORDIA DR | 8 |
| COUNTRY CLUB DR | 8 |
| Other | 360 |
2005 - 2018 National Fire Incident Reporting System (NFIRS) incidents
- Incident types reported to NFIRS in El Dorado Hills, CA
- 7,00357.3%Rescue & EMS
- 2,29018.7%Service Call
- 1,0268.4%Good Intent Call
- 9507.8%Fire
- 5344.4%False Alarm
- 3703.0%Hazardous Condition
- 330.3%Special Incident
- 170.1%Severe Weather
- Fire incident types reported to NFIRS in El Dorado Hills, CA
- 46248.6%Outside Fires
- 27128.5%Structure Fires
- 12513.2%Mobile Property/Vehicle Fires
- 929.7%Other
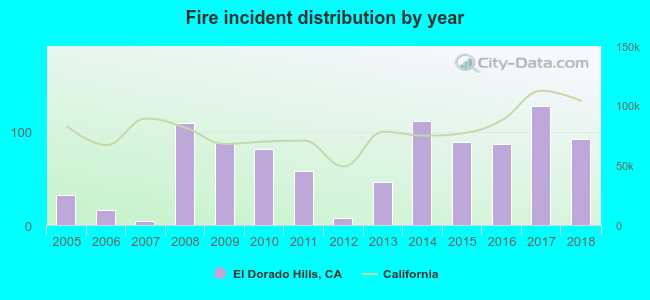 According to the data from the years 2005 - 2018 the average number of fires per year is 68. The highest number of reported fires - 128 took place in 2017, and the least - 4 in 2007. The data has an increasing trend.
The average number of yearly fire incidents per 10k residents in El Dorado Hills, CA compared to nearest cities:
(Note: Based on data for the last 3 years, including only cities with population 5,000 and above)
| El Dorado Hills: | 24.3 |
| Folsom: | 7.3 |
| Cameron Park: | 17.6 |
| Granite Bay: | 28.4 |
| Orangevale: | 13.5 |
| Fair Oaks: | 14.0 |
| Gold River: | 2.5 |
| Loomis: | 98.1 |
| Citrus Heights: | 28.1 |
 The median response time based on all reported fire incidents is 6 minutes. This is about the same as the state median value.
The median response time in El Dorado Hills, CA compared to nearest cities:
(Note: Based on data for all years, including only cities with at least 500 fire incidents)
| El Dorado Hills: | 6 minutes |
| Granite Bay: | 7 minutes |
| Orangevale: | 5 minutes |
| Fair Oaks: | 5 minutes |
| Loomis: | 8 minutes |
| Citrus Heights: | 5 minutes |
| Rocklin: | 6 minutes |
| Roseville: | 5 minutes |
| Carmichael: | 5 minutes |
 33.2% incidents where reported in the morning and 66.8% in the evening. The most fires (16.8%) took place on Friday, and the least (13.1%) on Thursday.
 According to the 950 fires from years 2005 - 2018 most fires (15.3%) took place during July, and the least (4.0%) in February.
 Out of all 12,230 cases reported during the years 2005 - 2018, the most belonged to the categories: Rescue & EMS (57.3%), Service Call (18.7%), and Good Intent Call (8.4%).
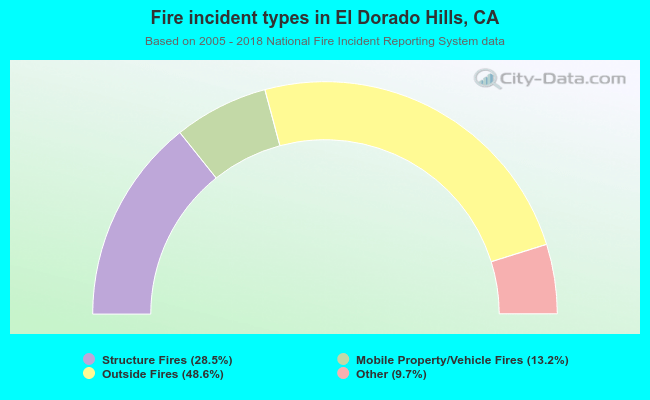 When looking into fire subcategories, the most incidents belonged to: Outside Fires (48.6%), and Structure Fires (28.5%).