Carmichael: Fire Incidents, California (CA)
Where are fire incidents reported in Carmichael, CA
Something went wrong! Please refresh the page.
| Fire incidents reported | |
|---|---|
| Sreet name | Count |
| FAIR OAKS BL | 214 |
| FAIR OAKS | 108 |
| DEWEY DR | 96 |
| MARCONI AV | 66 |
| MADISON | 62 |
| MANZANITA AV | 56 |
| MANZANITA | 54 |
| MARCONI | 50 |
| MADISON AV | 44 |
| GIBBONS DR | 34 |
| GARFIELD AV | 30 |
| CYPRESS AV | 26 |
| ENGLE RD | 26 |
| HACKBERRY LN | 26 |
| SUTTER AV | 26 |
| WALNUT AV | 26 |
| KENNETH AV | 24 |
| GUNN RD | 22 |
| JAN DR | 22 |
| LINCOLN AV | 22 |
| CARMICHAEL WY | 20 |
| KENNETH | 20 |
| EL CAMINO AV | 18 |
| GLENRIDGE DR | 18 |
| CALIFORNIA AV | 14 |
| CYPRESS | 14 |
| GRANT AV | 14 |
| SAN JUAN | 14 |
| SAN JUAN AV | 14 |
| SUTTER | 14 |
2005 - 2018 National Fire Incident Reporting System (NFIRS) incidents
- Incident types reported to NFIRS in Carmichael, CA
- 17,98770.6%Rescue & EMS
- 2,70610.6%Good Intent Call
- 2,2128.7%Service Call
- 1,0704.2%Fire
- 7512.9%False Alarm
- 6402.5%Hazardous Condition
- 860.3%Special Incident
- Fire incident types reported to NFIRS in Carmichael, CA
- 47844.7%Outside Fires
- 32230.1%Structure Fires
- 17316.2%Mobile Property/Vehicle Fires
- 979.1%Other
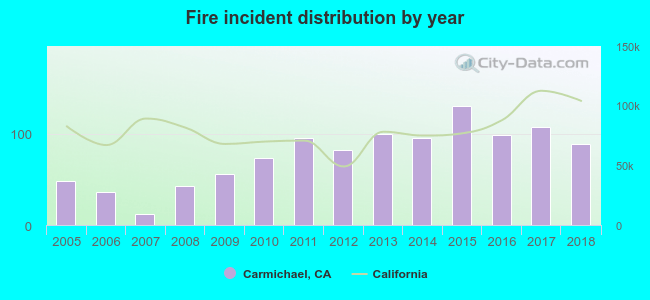 Based on the data from the years 2005 - 2018 the average number of fires per year is 76. The highest number of reported fire incidents - 131 took place in 2015, and the least - 12 in 2007. The data has a rising trend.
The average number of yearly fire incidents per 10k residents in Carmichael, CA compared to nearest cities:
(Note: Based on data for the last 3 years, including only cities with population 5,000 and above)
| Carmichael: | 16.0 |
| Fair Oaks: | 14.0 |
| North Highlands: | 46.8 |
| Rancho Cordova: | 32.6 |
| Mather: | 36.7 |
| Gold River: | 2.5 |
| Citrus Heights: | 28.1 |
| Antelope: | 11.7 |
| Orangevale: | 13.5 |
 The median response time based on all reported fire incidents is 5 minutes. This is lower than the state median value.
The median response time in Carmichael, CA compared to nearest cities:
(Note: Based on data for all years, including only cities with at least 500 fire incidents)
| Carmichael: | 5 minutes |
| Fair Oaks: | 5 minutes |
| North Highlands: | 5 minutes |
| Rancho Cordova: | 5 minutes |
| Mather: | 6 minutes |
| Citrus Heights: | 5 minutes |
| Antelope: | 5 minutes |
| Orangevale: | 5 minutes |
| Rio Linda: | 5 minutes |
 Based on the data from the years 2005 - 2018 the average number of fire-related casualties per year is 0. The highest number of reported casualties - 4 took place in 2005, and the lowest - 0 in 2006. The data has a declining trend.
The average number of injuries per 1,000 fires is 8. This indicator was the highest - 83 in 2005, and the lowest 0 in 2006. The trend for injuries per 1,000 fires is dropping. Compared to the state value the number of casualties per 1,000 fire incidents is about the same.
Based on the data from the years 2005 - 2018 the average number of fire-related casualties per year is 0. The highest number of reported casualties - 4 took place in 2005, and the lowest - 0 in 2006. The data has a declining trend.
The average number of injuries per 1,000 fires is 8. This indicator was the highest - 83 in 2005, and the lowest 0 in 2006. The trend for injuries per 1,000 fires is dropping. Compared to the state value the number of casualties per 1,000 fire incidents is about the same.Casualties per 1,000 incidents in Carmichael, CA compared to nearest cities:
(Note: Based on data for all years, including only cities with at least 500 fire incidents)
| Carmichael: | 5.6 |
| Fair Oaks: | 3.6 |
| North Highlands: | 0.0 |
| Rancho Cordova: | 4.0 |
| Mather: | 0.0 |
| Citrus Heights: | 3.8 |
| Antelope: | 1.5 |
| Orangevale: | 1.7 |
| Rio Linda: | 1.2 |
 35.4% incidents where reported in the morning and 64.6% in the evening. The most fires (15.7%) took place on Saturday, and the least (12.5%) on Wednesday.
 Based on the 1,070 reports from years 2005 - 2018 most fires (13.4%) took place during July, and the least (6.2%) in April.
 Out of all 25,465 cases reported during the years 2005 - 2018, the most belonged to the categories: Rescue & EMS (70.6%), Good Intent Call (10.6%), and Service Call (8.7%).
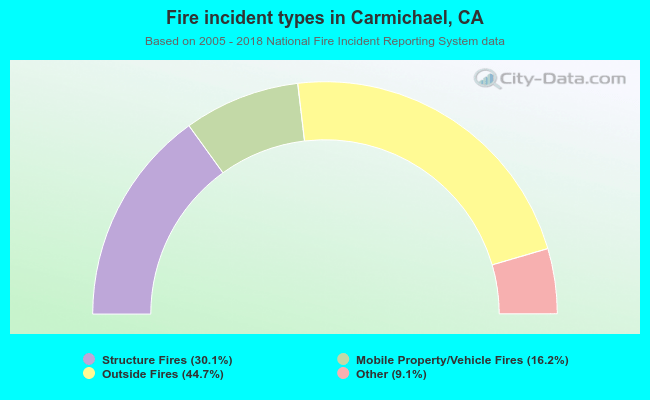 When looking into fire subcategories, the most reports belonged to: Outside Fires (44.7%), and Structure Fires (30.1%).