Rancho Cordova: Fire Incidents, California (CA)
Where are fire incidents reported in Rancho Cordova, CA
Something went wrong! Please refresh the page.
| Fire incidents reported | |
|---|---|
| Sreet name | Count |
| FOLSOM BL | 300 |
| COLOMA RD | 254 |
| ARP | 250 |
| FOLSOM | 218 |
| WHITE ROCK RD | 144 |
| SUNRISE BL | 124 |
| DATA DR | 116 |
| SUNRISE | 88 |
| LA LOMA DR | 80 |
| MATHER FIELD RD | 80 |
| OLSON DR | 80 |
| ZINFANDEL DR | 76 |
| DOUGLAS RD | 74 |
| CHASE DR | 72 |
| AMBASSADOR DR | 60 |
| MILLS STATION RD | 56 |
| INTERNATIONAL DR | 52 |
| DAWES ST | 46 |
| EAGLES NEST RD | 42 |
| ROUTIER RD | 40 |
| BENITA DR | 36 |
| LAURELHURST DR | 36 |
| GRANT LINE RD | 32 |
| MILLS TOWER DR | 32 |
| BRAVADO DR | 30 |
| FITZGERALD RD | 30 |
| LUYUNG DR | 30 |
| POINT EAST DR | 30 |
| RECYCLE RD | 28 |
| CORDOVA LN | 26 |
2005 - 2018 National Fire Incident Reporting System (NFIRS) incidents
- Incident types reported to NFIRS in Rancho Cordova, CA
- 25,36069.1%Rescue & EMS
- 3,80010.4%Good Intent Call
- 2,5096.8%Fire
- 2,2736.2%Service Call
- 1,6624.5%False Alarm
- 9932.7%Hazardous Condition
- 640.2%Special Incident
- Fire incident types reported to NFIRS in Rancho Cordova, CA
- 1,38855.3%Outside Fires
- 47018.7%Structure Fires
- 44217.6%Mobile Property/Vehicle Fires
- 2098.3%Other
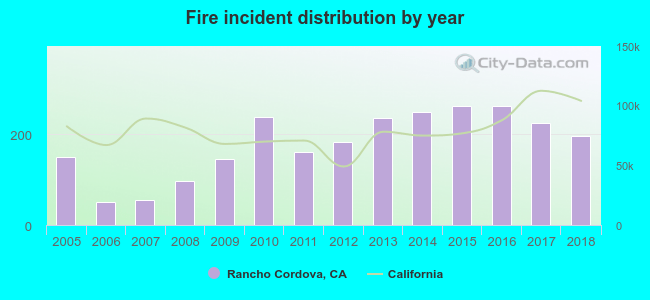 According to the data from the years 2005 - 2018 the average number of fires per year is 179. The highest number of reported fire incidents - 263 took place in 2015, and the least - 50 in 2006. The data has a rising trend.
The average number of yearly fire incidents per 10k residents in Rancho Cordova, CA compared to nearest cities:
(Note: Based on data for the last 3 years, including only cities with population 5,000 and above)
| Rancho Cordova: | 32.6 |
| Mather: | 36.7 |
| Gold River: | 2.5 |
| Carmichael: | 16.0 |
| Fair Oaks: | 14.0 |
| North Highlands: | 46.8 |
| Citrus Heights: | 28.1 |
| Orangevale: | 13.5 |
| Antelope: | 11.7 |
 The median response time based on all reported fire incidents is 5 minutes. This is lower compared to the California median value.
The median response time in Rancho Cordova, CA compared to nearest cities:
(Note: Based on data for all years, including only cities with at least 500 fire incidents)
| Rancho Cordova: | 5 minutes |
| Mather: | 6 minutes |
| Carmichael: | 5 minutes |
| Fair Oaks: | 5 minutes |
| North Highlands: | 5 minutes |
| Citrus Heights: | 5 minutes |
| Orangevale: | 5 minutes |
| Antelope: | 5 minutes |
| Florin: | 5 minutes |
 Based on the reports from the years 2005 - 2018 the average number of fire-related yearly casualties is 1. The highest number of injuries - 3 took place in 2010, and the lowest - 0 in 2005. The data has a constant trend.
The average number of casualties per 1,000 fires is 4. This indicator was the highest - 20 in 2008, and the lowest 0 in 2005. The trend for casualties per 1,000 fires is constant. Compared to the state value the number of casualties per 1,000 fire incidents is lower.
Based on the reports from the years 2005 - 2018 the average number of fire-related yearly casualties is 1. The highest number of injuries - 3 took place in 2010, and the lowest - 0 in 2005. The data has a constant trend.
The average number of casualties per 1,000 fires is 4. This indicator was the highest - 20 in 2008, and the lowest 0 in 2005. The trend for casualties per 1,000 fires is constant. Compared to the state value the number of casualties per 1,000 fire incidents is lower.Casualties per 1,000 incidents in Rancho Cordova, CA compared to nearest cities:
(Note: Based on data for all years, including only cities with at least 500 fire incidents)
| Rancho Cordova: | 4.0 |
| Mather: | 0.0 |
| Carmichael: | 5.6 |
| Fair Oaks: | 3.6 |
| North Highlands: | 0.0 |
| Citrus Heights: | 3.8 |
| Orangevale: | 1.7 |
| Antelope: | 1.5 |
| Florin: | 3.6 |
 34.4% incidents where reported in the morning and 65.6% in the evening. The most fires (15.9%) took place on Sunday, and the least (12.6%) on Tuesday.
 According to the 2,509 incident reports from years 2005 - 2018 most fires (14.8%) took place during July, and the least (5.2%) in January.
 Out of all 36,696 cases reported during the years 2005 - 2018, the most belonged to the categories: Rescue & EMS (69.1%), Good Intent Call (10.4%), and Fire (6.8%).
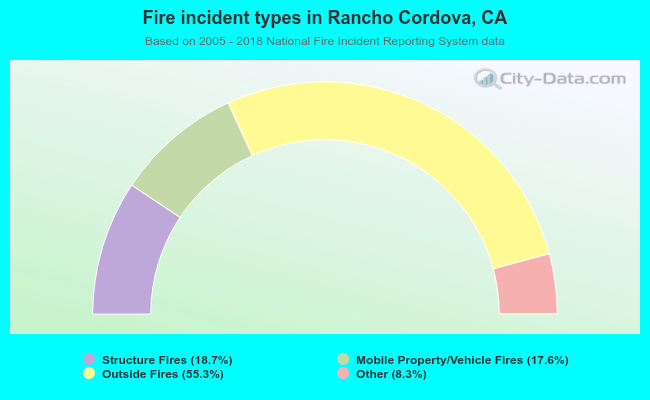 When looking into fire subcategories, the most incidents belonged to: Outside Fires (55.3%), and Structure Fires (18.7%).