Fair Oaks: Fire Incidents, California (CA)
Where are fire incidents reported in Fair Oaks, CA
Something went wrong! Please refresh the page.
|
| |||||||||||||||||||||||||||||||||||||||||||||||||||||||||||||||||||||||||||||||||||||||||||||||||||||||||||||
2005 - 2018 National Fire Incident Reporting System (NFIRS) incidents
- Incident types reported to NFIRS in Fair Oaks, CA
- 8,62868.6%Rescue & EMS
- 1,30610.4%Good Intent Call
- 1,1329.0%Service Call
- 5554.4%Fire
- 4713.7%False Alarm
- 4553.6%Hazardous Condition
- 220.2%Special Incident
- Fire incident types reported to NFIRS in Fair Oaks, CA
- 25545.9%Outside Fires
- 15327.6%Structure Fires
- 8214.8%Mobile Property/Vehicle Fires
- 6511.7%Other
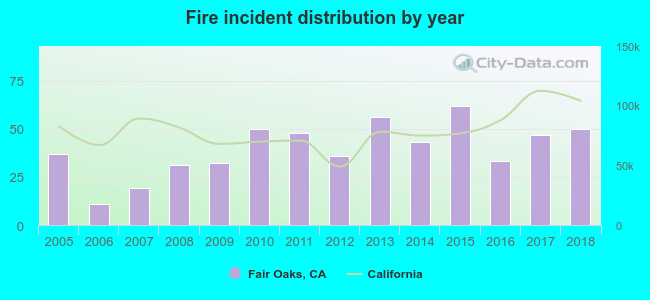 Based on the data from the years 2005 - 2018 the average number of fires per year is 40. The highest number of reported fires - 62 took place in 2015, and the least - 11 in 2006. The data has an increasing trend.
The average number of yearly fire incidents per 10k residents in Fair Oaks, CA compared to nearest cities:
(Note: Based on data for the last 3 years, including only cities with population 5,000 and above)
| Fair Oaks: | 14.0 |
| Gold River: | 2.5 |
| Orangevale: | 13.5 |
| Citrus Heights: | 28.1 |
| Carmichael: | 16.0 |
| Rancho Cordova: | 32.6 |
| Mather: | 36.7 |
| Antelope: | 11.7 |
| Folsom: | 7.3 |
 The median response time based on all reported fire incidents is 5 minutes. This is lower than the state median value.
The median response time in Fair Oaks, CA compared to nearest cities:
(Note: Based on data for all years, including only cities with at least 500 fire incidents)
| Fair Oaks: | 5 minutes |
| Orangevale: | 5 minutes |
| Citrus Heights: | 5 minutes |
| Carmichael: | 5 minutes |
| Rancho Cordova: | 5 minutes |
| Mather: | 6 minutes |
| Antelope: | 5 minutes |
| North Highlands: | 5 minutes |
| Roseville: | 5 minutes |
 36.0% incidents where reported in the morning and 64.0% in the evening. The most fires (17.5%) took place on Saturday, and the least (12.4%) on Tuesday.
 Based on the 555 fires from years 2005 - 2018 most fires (17.7%) took place during July, and the least (5.4%) in February.
 Out of all 12,578 cases reported during the years 2005 - 2018, the most belonged to the categories: Rescue & EMS (68.6%), Good Intent Call (10.4%), and Service Call (9.0%).
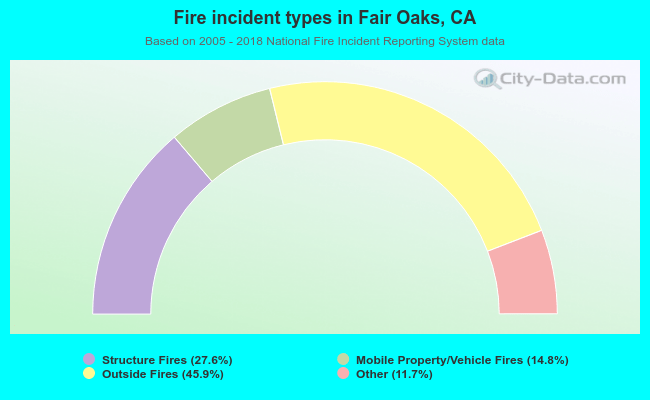 When looking into fire subcategories, the most incidents belonged to: Outside Fires (45.9%), and Structure Fires (27.6%).