Citrus Heights: Fire Incidents, California (CA)
Where are fire incidents reported in Citrus Heights, CA
Something went wrong! Please refresh the page.
| Fire incidents reported | |
|---|---|
| Sreet name | Count |
| GREENBACK LN | 594 |
| AUBURN BL | 214 |
| SUNRISE BL | 184 |
| AUBURN | 178 |
| ANTELOPE RD | 124 |
| SUNRISE | 86 |
| OAK AV | 78 |
| FAIR OAKS BL | 72 |
| BIRDCAGE ST | 54 |
| ARCADIA DR | 52 |
| OLD AUBURN RD | 52 |
| MARIPOSA AV | 50 |
| GARFIELD AV | 48 |
| DEWEY DR | 46 |
| SUNRISE VISTA DR | 46 |
| COYLE AV | 42 |
| FAIR OAKS | 42 |
| SYLVAN RD | 40 |
| AUBURN OAKS CT | 36 |
| DEVECCHI AV | 36 |
| HACKBERRY LN | 36 |
| MADISON AV | 36 |
| MARIPOSA | 36 |
| MADISON | 34 |
| OAK | 34 |
| SAYONARA DR | 34 |
| KINGSWOOD DR | 30 |
| SAN JUAN AV | 26 |
| SUNGARDEN DR | 24 |
| VAN MAREN LN | 24 |
2005 - 2018 National Fire Incident Reporting System (NFIRS) incidents
- Incident types reported to NFIRS in Citrus Heights, CA
- 30,88569.9%Rescue & EMS
- 4,78910.8%Good Intent Call
- 3,5488.0%Service Call
- 2,3735.4%Fire
- 1,3263.0%False Alarm
- 1,1822.7%Hazardous Condition
- 630.1%Special Incident
- Fire incident types reported to NFIRS in Citrus Heights, CA
- 1,24752.5%Outside Fires
- 49620.9%Structure Fires
- 34514.5%Mobile Property/Vehicle Fires
- 28512.0%Other
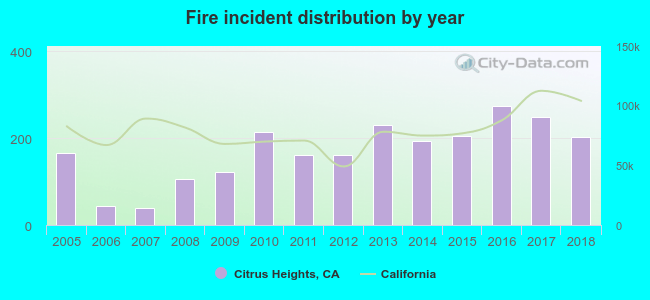 According to the data from the years 2005 - 2018 the average number of fire incidents per year is 170. The highest number of reported fire incidents - 275 took place in 2016, and the least - 39 in 2007. The data has a rising trend.
The average number of yearly fire incidents per 10k residents in Citrus Heights, CA compared to nearest cities:
(Note: Based on data for the last 3 years, including only cities with population 5,000 and above)
| Citrus Heights: | 28.1 |
| Antelope: | 11.7 |
| Fair Oaks: | 14.0 |
| Roseville: | 22.8 |
| Carmichael: | 16.0 |
| Orangevale: | 13.5 |
| North Highlands: | 46.8 |
| Gold River: | 2.5 |
| Granite Bay: | 28.4 |
 The median response time based on all reported fire incidents is 5 minutes. This is lower than the state median value.
The median response time in Citrus Heights, CA compared to nearest cities:
(Note: Based on data for all years, including only cities with at least 500 fire incidents)
| Citrus Heights: | 5 minutes |
| Antelope: | 5 minutes |
| Fair Oaks: | 5 minutes |
| Roseville: | 5 minutes |
| Carmichael: | 5 minutes |
| Orangevale: | 5 minutes |
| North Highlands: | 5 minutes |
| Granite Bay: | 7 minutes |
| Rancho Cordova: | 5 minutes |
 According to the reports from the years 2005 - 2018 the average number of fire-related yearly casualties is 1. The highest number of injuries - 2 took place in 2010, and the lowest - 0 in 2006. The data has a decreasing trend.
The average number of casualties per 1,000 fires is 4. This indicator was the highest - 10 in 2008, and the lowest 0 in 2006. The trend for casualties per 1,000 fire incidents is decreasing. Compared to the state value the number of casualties per 1,000 fire incidents is lower.
According to the reports from the years 2005 - 2018 the average number of fire-related yearly casualties is 1. The highest number of injuries - 2 took place in 2010, and the lowest - 0 in 2006. The data has a decreasing trend.
The average number of casualties per 1,000 fires is 4. This indicator was the highest - 10 in 2008, and the lowest 0 in 2006. The trend for casualties per 1,000 fire incidents is decreasing. Compared to the state value the number of casualties per 1,000 fire incidents is lower.Casualties per 1,000 incidents in Citrus Heights, CA compared to nearest cities:
(Note: Based on data for all years, including only cities with at least 500 fire incidents)
| Citrus Heights: | 3.8 |
| Antelope: | 1.5 |
| Fair Oaks: | 3.6 |
| Roseville: | 8.2 |
| Carmichael: | 5.6 |
| Orangevale: | 1.7 |
| North Highlands: | 0.0 |
| Granite Bay: | 1.8 |
| Rancho Cordova: | 4.0 |
 30.0% incidents where reported in the morning and 70.0% in the evening. The most fires (15.3%) took place on Thursday, and the least (13.6%) on Saturday.
 Based on the 2,373 fires from years 2005 - 2018 most fires (15.2%) took place during July, and the least (4.8%) in March.
 Out of all 44,206 cases reported during the years 2005 - 2018, the most belonged to the categories: Rescue & EMS (69.9%), Good Intent Call (10.8%), and Service Call (8.0%).
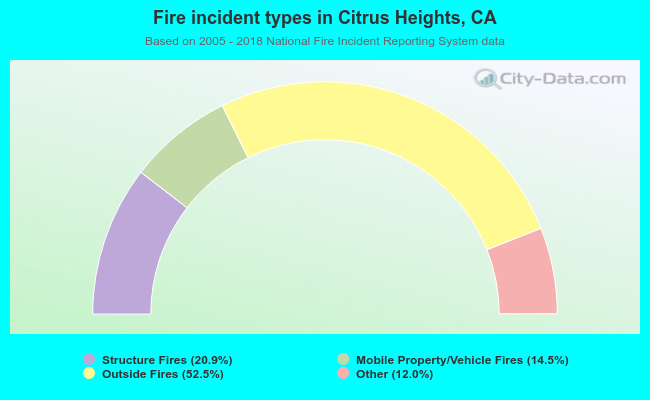 When looking into fire subcategories, the most reports belonged to: Outside Fires (52.5%), and Structure Fires (20.9%).