New Port Richey: Fire Incidents, Florida (FL)
Where are fire incidents reported in New Port Richey, FL
Something went wrong! Please refresh the page.
| Fire incidents reported | |
|---|---|
| Sreet name | Count |
| US 19 | 194 |
| LITTLE RD | 184 |
| MASSACHUSETTS AVE | 112 |
| US 19 HWY | 92 |
| GRAND BLVD | 88 |
| MOON LAKE RD | 76 |
| STATE ROAD 54 HWY | 64 |
| TROUBLE CREEK RD | 64 |
| MAIN ST | 60 |
| US HWY 19 | 60 |
| ROWAN RD | 58 |
| SR 54 HWY | 54 |
| CONGRESS ST | 50 |
| MADISON ST | 50 |
| RIDGE RD | 46 |
| MONTANA AVE | 42 |
| US HIGHWAY 19 | 42 |
| INDIANA AVE | 40 |
| SR 54 | 40 |
| LAKE DR | 36 |
| MARINE PKY | 34 |
| WILDERNESS PARK BLVD | 34 |
| SEVEN SPRINGS BLVD | 32 |
| GULF DR | 30 |
| SR 54 RD | 30 |
| GARDEN DR | 28 |
| ILLINOIS AVE | 28 |
| PLATHE RD | 28 |
| US HIGHWAY 19 HWY | 28 |
| AZALEA DR | 26 |
| Other | 984 |
2002 - 2018 National Fire Incident Reporting System (NFIRS) incidents
- Incident types reported to NFIRS in New Port Richey, FL
- 74,83973.2%Rescue & EMS
- 8,2668.1%Good Intent Call
- 8,1117.9%Service Call
- 4,3924.3%Hazardous Condition
- 3,6883.6%False Alarm
- 2,7342.7%Fire
- Fire incident types reported to NFIRS in New Port Richey, FL
- 1,12941.3%Outside Fires
- 98736.1%Structure Fires
- 53319.5%Mobile Property/Vehicle Fires
- 853.1%Other
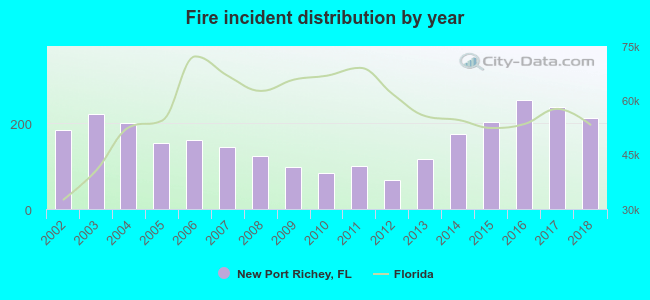 According to the data from the years 2002 - 2018 the average number of fires per year is 161. The highest number of reported fire incidents - 253 took place in 2016, and the least - 67 in 2012. The data has a rising trend.
The average number of yearly fire incidents per 10k residents in New Port Richey, FL compared to nearest cities:
(Note: Based on data for the last 3 years, including only cities with population 5,000 and above)
| New Port Richey: | 151.1 |
| Holiday: | 35.6 |
| Bayonet Point: | 9.9 |
| Trinity: | 3.7 |
| Tarpon Springs: | 50.2 |
| Hudson: | 95.7 |
| Odessa: | 19.3 |
| East Lake: | 0.3 |
| Keystone: | 0.4 |
 The median response time based on all reported fire incidents is 6 minutes. This is about the same as the state median value.
The median response time in New Port Richey, FL compared to nearest cities:
(Note: Based on data for all years, including only cities with at least 500 fire incidents)
| New Port Richey: | 6 minutes |
| Port Richey: | 5 minutes |
| Holiday: | 6 minutes |
| Tarpon Springs: | 6 minutes |
| Hudson: | 8 minutes |
| Palm Harbor: | 6 minutes |
| Oldsmar: | 6 minutes |
| Dunedin: | 5 minutes |
| Safety Harbor: | 5 minutes |
 Based on the reports from the years 2002 - 2018 the average number of fire-related yearly deaths is 0. The highest number of reported deaths - 2 took place in 2014, and the lowest - 0 in 2004. The data has a dropping trend.
The average number of deaths per 1,000 fire incidents is 3. This indicator was the highest - 15 in 2012, and the lowest 0 in 2004. The trend for fatalities per 1,000 fires is declining. Compared to the Florida value the number of deaths per 1,000 incidents is higher.
Based on the reports from the years 2002 - 2018 the average number of fire-related yearly deaths is 0. The highest number of reported deaths - 2 took place in 2014, and the lowest - 0 in 2004. The data has a dropping trend.
The average number of deaths per 1,000 fire incidents is 3. This indicator was the highest - 15 in 2012, and the lowest 0 in 2004. The trend for fatalities per 1,000 fires is declining. Compared to the Florida value the number of deaths per 1,000 incidents is higher.Deaths per 1,000 incidents in New Port Richey, FL compared to nearest cities:
(Note: Based on data for all years, including only cities with at least 2,500 fire incidents)
| New Port Richey: | 2.9 |
| Clearwater: | 0.7 |
| Largo: | 2.0 |
| Tampa: | 2.0 |
| Pinellas Park: | 2.3 |
 According to the data from the years 2002 - 2018 the average number of fire-related yearly casualties is 4. The highest number of injuries - 14 took place in 2016, and the lowest - 0 in 2004. The data has a growing trend.
The average number of casualties per 1,000 fire incidents is 24. This indicator was the highest - 69 in 2014, and the lowest 0 in 2004. The trend for casualties per 1,000 incidents is growing. Compared to the Florida value the number of casualties per 1,000 incidents is much higher.
According to the data from the years 2002 - 2018 the average number of fire-related yearly casualties is 4. The highest number of injuries - 14 took place in 2016, and the lowest - 0 in 2004. The data has a growing trend.
The average number of casualties per 1,000 fire incidents is 24. This indicator was the highest - 69 in 2014, and the lowest 0 in 2004. The trend for casualties per 1,000 incidents is growing. Compared to the Florida value the number of casualties per 1,000 incidents is much higher.Casualties per 1,000 incidents in New Port Richey, FL compared to nearest cities:
(Note: Based on data for all years, including only cities with at least 500 fire incidents)
| New Port Richey: | 25.6 |
| Port Richey: | 17.5 |
| Holiday: | 46.5 |
| Tarpon Springs: | 26.3 |
| Hudson: | 25.8 |
| Palm Harbor: | 47.8 |
| Oldsmar: | 11.4 |
| Dunedin: | 55.1 |
| Safety Harbor: | 48.0 |
 30.5% incidents where reported in the morning and 69.5% in the evening. The most fires (15.1%) took place on Monday, and the least (13.2%) on Friday.
 According to the 2,734 fire incident reports from years 2002 - 2018 most fires (11.6%) took place during April, and the least (6.1%) in September.
 Out of all 102,234 cases reported during the years 2002 - 2018, the most belonged to the categories: Rescue & EMS (73.2%), Good Intent Call (8.1%), and Service Call (7.9%).
 When looking into fire subcategories, the most incidents belonged to: Outside Fires (41.3%), and Structure Fires (36.1%).