Pinellas Park: Fire Incidents, Florida (FL)
Where are fire incidents reported in Pinellas Park, FL
Something went wrong! Please refresh the page.
| Fire incidents reported | |
|---|---|
| Sreet name | Count |
| PARK BLVD | 460 |
| US 19 HWY | 394 |
| 66 ST | 268 |
| 49 ST | 264 |
| 70 AVE | 140 |
| 62 AVE | 132 |
| 78 AVE | 126 |
| PARK N BLVD | 118 |
| BELCHER RD | 92 |
| 49 N ST | 86 |
| 72 AVE | 82 |
| 76 AVE | 80 |
| US 19 N HWY | 80 |
| 102 AVE | 78 |
| 60 ST | 74 |
| 58 ST | 72 |
| 67 AVE | 72 |
| 66 N ST | 70 |
| 82 AVE | 70 |
| BRYAN DAIRY RD | 70 |
| 62 ST | 66 |
| 34 ST | 64 |
| 35 ST | 64 |
| 110 AVE | 62 |
| 68 AVE | 54 |
| 118 N AVE | 52 |
| 52 ST | 52 |
| 66 AVE | 50 |
| 84 AVE | 50 |
| 114 AVE | 48 |
| Other | 83 |
2005 - 2018 National Fire Incident Reporting System (NFIRS) incidents
- Incident types reported to NFIRS in Pinellas Park, FL
- 47,46274.1%Rescue & EMS
- 8,61213.4%Good Intent Call
- 3,4735.4%Fire
- 2,5624.0%Hazardous Condition
- 1,3222.1%False Alarm
- 5850.9%Service Call
- Fire incident types reported to NFIRS in Pinellas Park, FL
- 1,58945.8%Structure Fires
- 1,07430.9%Outside Fires
- 57016.4%Mobile Property/Vehicle Fires
- 2406.9%Other
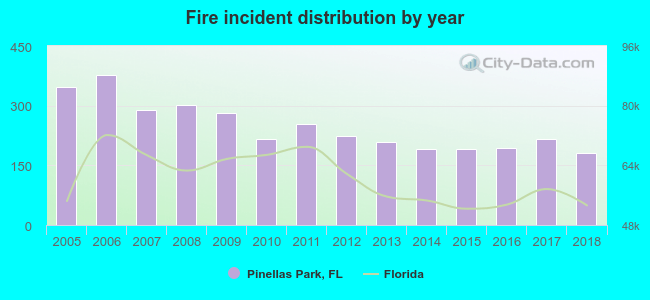 Based on the data from the years 2005 - 2018 the average number of fires per year is 248. The highest number of reported fire incidents - 378 took place in 2006, and the least - 182 in 2018. The data has a declining trend.
The average number of yearly fire incidents per 10k residents in Pinellas Park, FL compared to nearest cities:
(Note: Based on data for the last 3 years, including only cities with population 5,000 and above)
| Pinellas Park: | 38.7 |
| Kenneth City: | 6.6 |
| Lealman: | 15.8 |
| Seminole: | 58.6 |
| Largo: | 32.8 |
| Treasure Island: | 29.9 |
| Gulfport: | 23.5 |
| South Pasadena: | 29.1 |
| Clearwater: | 44.1 |
 The median response time based on all reported fire incidents is 5 minutes. This is lower than the Florida median value.
The median response time in Pinellas Park, FL compared to nearest cities:
(Note: Based on data for all years, including only cities with at least 500 fire incidents)
| Pinellas Park: | 5 minutes |
| Lealman: | 5 minutes |
| Seminole: | 5 minutes |
| St. Petersburg: | 4 minutes |
| Largo: | 5 minutes |
| Gulfport: | 5 minutes |
| Clearwater: | 5 minutes |
| Safety Harbor: | 5 minutes |
| Dunedin: | 5 minutes |
 According to the reports from the years 2005 - 2018 the average number of fire-related fatalities per year is 1. The highest number of reported deaths - 2 took place in 2008, and the lowest - 0 in 2005. The data has a constant trend.
The average number of deaths per 1,000 fire incidents is 3. This indicator was the highest - 10 in 2014, and the lowest 0 in 2005. The trend for fatalities per 1,000 incidents is constant. Compared to the Florida value the number of fatalities per 1,000 fire incidents is higher.
According to the reports from the years 2005 - 2018 the average number of fire-related fatalities per year is 1. The highest number of reported deaths - 2 took place in 2008, and the lowest - 0 in 2005. The data has a constant trend.
The average number of deaths per 1,000 fire incidents is 3. This indicator was the highest - 10 in 2014, and the lowest 0 in 2005. The trend for fatalities per 1,000 incidents is constant. Compared to the Florida value the number of fatalities per 1,000 fire incidents is higher.Deaths per 1,000 incidents in Pinellas Park, FL compared to nearest cities:
(Note: Based on data for all years, including only cities with at least 2,500 fire incidents)
| Pinellas Park: | 2.3 |
| St. Petersburg: | 0.9 |
| Largo: | 2.0 |
| Clearwater: | 0.7 |
| Tampa: | 2.0 |
 Based on the data from the years 2005 - 2018 the average number of fire-related yearly casualties is 12. The highest number of injuries - 29 took place in 2012, and the lowest - 4 in 2005. The data has a rising trend.
The average number of casualties per 1,000 fires is 49. This indicator was the highest - 129 in 2012, and the lowest 12 in 2005. The trend for casualties per 1,000 fires is growing. Compared to the state value the number of casualties per 1,000 incidents is much higher.
Based on the data from the years 2005 - 2018 the average number of fire-related yearly casualties is 12. The highest number of injuries - 29 took place in 2012, and the lowest - 4 in 2005. The data has a rising trend.
The average number of casualties per 1,000 fires is 49. This indicator was the highest - 129 in 2012, and the lowest 12 in 2005. The trend for casualties per 1,000 fires is growing. Compared to the state value the number of casualties per 1,000 incidents is much higher.Casualties per 1,000 incidents in Pinellas Park, FL compared to nearest cities:
(Note: Based on data for all years, including only cities with at least 500 fire incidents)
| Pinellas Park: | 48.9 |
| Lealman: | 48.5 |
| Seminole: | 42.7 |
| St. Petersburg: | 24.4 |
| Largo: | 89.9 |
| Gulfport: | 24.2 |
| Clearwater: | 49.9 |
| Safety Harbor: | 48.0 |
| Dunedin: | 55.1 |
 30.4% incidents where reported in the morning and 69.6% in the evening. The most fires (15.5%) took place on Saturday, and the least (13.3%) on Friday.
 Based on the 3,473 fire incidents from years 2005 - 2018 most fires (10.4%) took place during March, and the least (6.6%) in September.
 Out of all 64,075 cases reported during the years 2005 - 2018, the most belonged to the categories: Rescue & EMS (74.1%), Good Intent Call (13.4%), and Fire (5.4%).
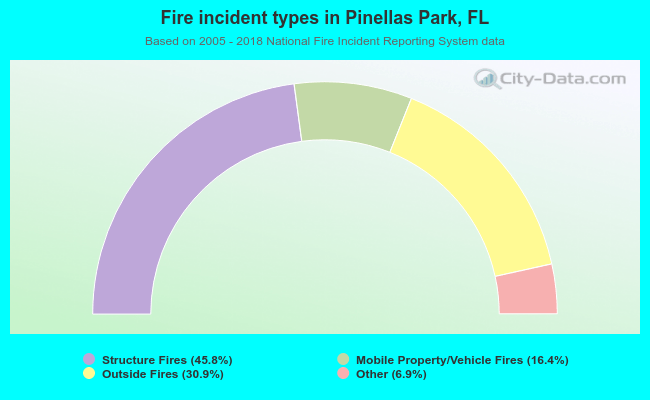 When looking into fire subcategories, the most incidents belonged to: Structure Fires (45.8%), and Outside Fires (30.9%).