Dunedin: Fire Incidents, Florida (FL)
Where are fire incidents reported in Dunedin, FL
Something went wrong! Please refresh the page.
| Fire incidents reported | |
|---|---|
| Sreet name | Count |
| MAIN ST | 228 |
| BAYSHORE BLVD | 98 |
| US 19 HWY | 78 |
| PATRICIA AVE | 76 |
| CURLEW RD | 54 |
| PAULA DR | 54 |
| DOUGLAS AVE | 50 |
| CAUSEWAY BLVD | 48 |
| PINEHURST RD | 44 |
| BROADWAY | 36 |
| MICHIGAN BLVD | 34 |
| MILWAUKEE AVE | 34 |
| SAN CHRISTOPHER DR | 32 |
| DUNCAN LOOP | 30 |
| EDGEWATER DR | 30 |
| NEW YORK AVE | 28 |
| UNION ST | 28 |
| VIRGINIA ST | 28 |
| BELCHER RD | 26 |
| BELTREES ST | 26 |
| LYNDHURST ST | 26 |
| CR 1 S | 24 |
| AMBERLEA DR | 22 |
| CR 1 | 22 |
| MARJON AVE | 22 |
| OVERCASH DR | 22 |
| SAN MATEO DR | 22 |
| BAYWOOD DR | 20 |
| DUNCAN LOOP | 20 |
| KEENE RD | 20 |
| Other | 223 |
2005 - 2018 National Fire Incident Reporting System (NFIRS) incidents
- Incident types reported to NFIRS in Dunedin, FL
- 22,45770.4%Rescue & EMS
- 4,31113.5%Good Intent Call
- 2,0486.4%Hazardous Condition
- 1,5054.7%Fire
- 1,0363.2%False Alarm
- 4911.5%Service Call
- 330.1%Severe Weather
- Fire incident types reported to NFIRS in Dunedin, FL
- 85356.7%Structure Fires
- 41927.8%Outside Fires
- 17011.3%Mobile Property/Vehicle Fires
- 634.2%Other
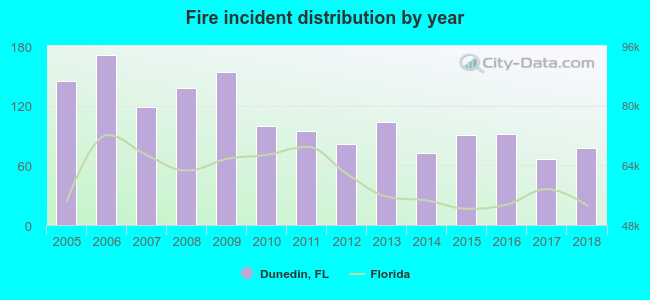 According to the data from the years 2005 - 2018 the average number of fires per year is 108. The highest number of fire incidents - 171 took place in 2006, and the least - 66 in 2017. The data has a declining trend.
The average number of yearly fire incidents per 10k residents in Dunedin, FL compared to nearest cities:
(Note: Based on data for the last 3 years, including only cities with population 5,000 and above)
| Dunedin: | 21.9 |
| Clearwater: | 44.1 |
| Palm Harbor: | 25.8 |
| Safety Harbor: | 19.7 |
| Oldsmar: | 49.8 |
| East Lake: | 0.3 |
| Largo: | 32.8 |
| Tarpon Springs: | 50.2 |
| Holiday: | 35.6 |
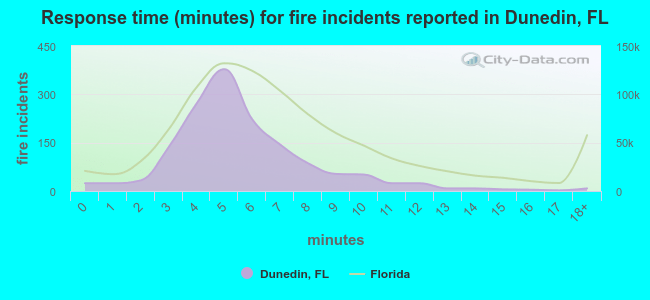 The median response time based on all reported fire incidents is 5 minutes. This is lower than the Florida median value.
The median response time in Dunedin, FL compared to nearest cities:
(Note: Based on data for all years, including only cities with at least 500 fire incidents)
| Dunedin: | 5 minutes |
| Clearwater: | 5 minutes |
| Palm Harbor: | 6 minutes |
| Safety Harbor: | 5 minutes |
| Oldsmar: | 6 minutes |
| Largo: | 5 minutes |
| Tarpon Springs: | 6 minutes |
| Holiday: | 6 minutes |
| Pinellas Park: | 5 minutes |
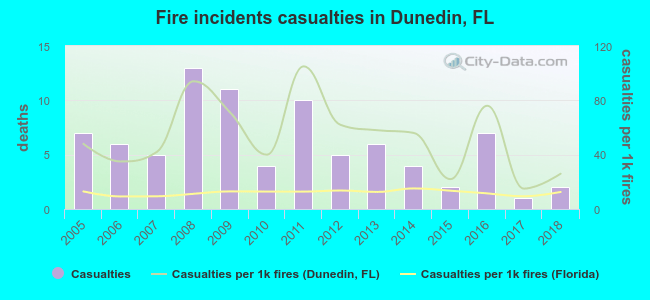 Based on the data from the years 2005 - 2018 the average number of fire-related yearly casualties is 6. The highest number of reported injuries - 13 took place in 2008, and the lowest - 1 in 2017. The data has a decreasing trend.
The average number of casualties per 1,000 fire incidents is 54. This indicator was the highest - 105 in 2011, and the lowest 15 in 2017. The trend for injuries per 1,000 fire incidents is decreasing. Compared to the Florida value the number of injuries per 1,000 incidents is much higher.
Based on the data from the years 2005 - 2018 the average number of fire-related yearly casualties is 6. The highest number of reported injuries - 13 took place in 2008, and the lowest - 1 in 2017. The data has a decreasing trend.
The average number of casualties per 1,000 fire incidents is 54. This indicator was the highest - 105 in 2011, and the lowest 15 in 2017. The trend for injuries per 1,000 fire incidents is decreasing. Compared to the Florida value the number of injuries per 1,000 incidents is much higher.Casualties per 1,000 incidents in Dunedin, FL compared to nearest cities:
(Note: Based on data for all years, including only cities with at least 500 fire incidents)
| Dunedin: | 55.1 |
| Clearwater: | 49.9 |
| Palm Harbor: | 47.8 |
| Safety Harbor: | 48.0 |
| Oldsmar: | 11.4 |
| Largo: | 89.9 |
| Tarpon Springs: | 26.3 |
| Holiday: | 46.5 |
| Pinellas Park: | 48.9 |
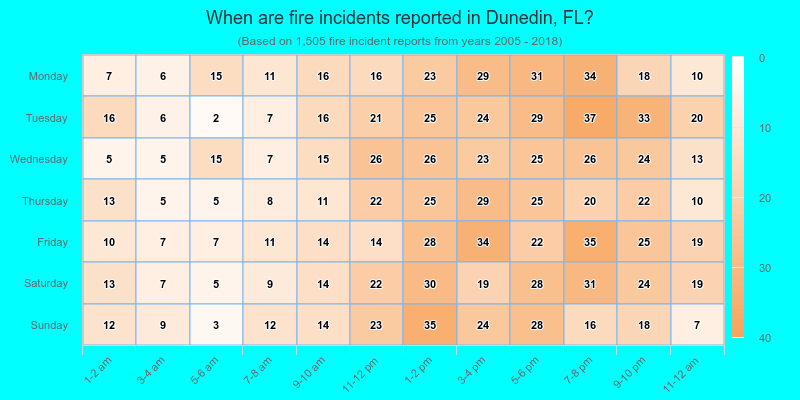
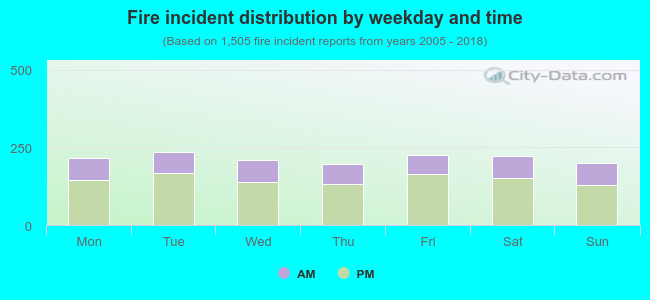 32.0% incidents where reported in the morning and 68.0% in the evening. The most fires (15.7%) took place on Tuesday, and the least (13.0%) on Thursday.
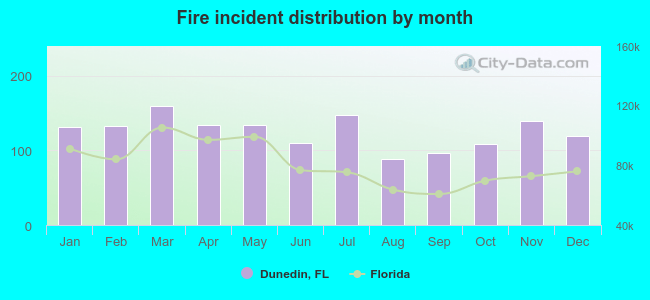 Based on the 1,505 incident reports from years 2005 - 2018 most fires (10.6%) took place during March, and the least (5.9%) in August.
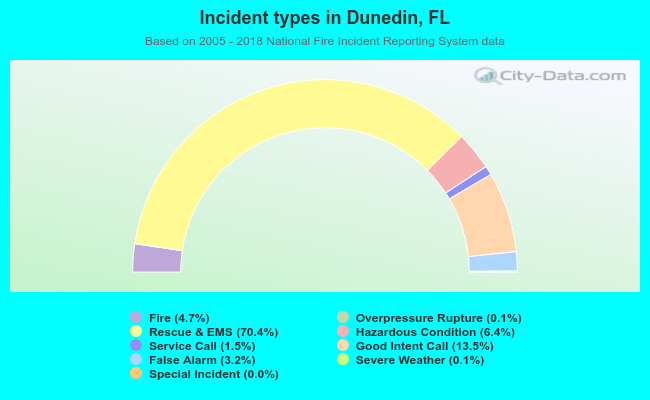 Out of all 31,911 cases reported during the years 2005 - 2018, the most belonged to the categories: Rescue & EMS (70.4%), Good Intent Call (13.5%), and Hazardous Condition (6.4%).
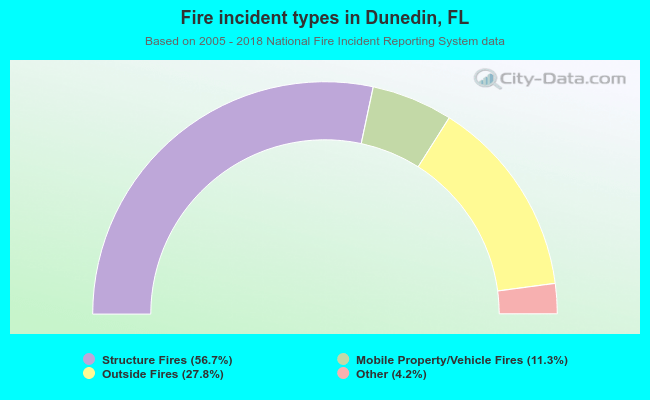 When looking into fire subcategories, the most reports belonged to: Structure Fires (56.7%), and Outside Fires (27.8%).