Clearwater: Fire Incidents, Florida (FL)
Where are fire incidents reported in Clearwater, FL
Something went wrong! Please refresh the page.
| Fire incidents reported | |
|---|---|
| Sreet name | Count |
| US 19 HWY | 972 |
| GULF TO BAY BLVD | 526 |
| DREW ST | 384 |
| ROOSEVELT BLVD | 314 |
| MCMULLEN BOOTH RD | 258 |
| ULMERTON RD | 256 |
| HIGHLAND AVE | 224 |
| NURSERY RD | 204 |
| 49 ST | 202 |
| SUNSET POINT RD | 174 |
| DRUID RD | 170 |
| COUNTRYSIDE BLVD | 168 |
| MISSOURI AVE | 148 |
| FAIRWOOD AVE | 146 |
| MARTIN LUTHER KING JR AVE | 142 |
| CLEVELAND ST | 130 |
| BELCHER RD | 124 |
| US 19 N HWY | 122 |
| BETTY LN | 118 |
| FORT HARRISON AVE | 114 |
| BELLEAIR RD | 100 |
| COURTNEY CAMPBELL CSWY | 96 |
| HERCULES AVE | 96 |
| TERMINAL BLVD | 94 |
| 126 AVE | 90 |
| HARN BLVD | 86 |
| PINELLAS ST | 84 |
| LAKEVIEW RD | 80 |
| EAST BAY DR | 76 |
| KINGS HWY | 72 |
| Other | 1,800 |
2005 - 2018 National Fire Incident Reporting System (NFIRS) incidents
- Incident types reported to NFIRS in Clearwater, FL
- 90,72967.6%Rescue & EMS
- 19,47214.5%Good Intent Call
- 8,2116.1%Hazardous Condition
- 7,5705.6%Fire
- 5,5734.2%False Alarm
- 2,0621.5%Service Call
- 2420.2%Severe Weather
- 2040.2%Special Incident
- 1810.1%Overpressure Rupture
- Fire incident types reported to NFIRS in Clearwater, FL
- 3,80250.2%Structure Fires
- 2,14928.4%Outside Fires
- 1,13215.0%Mobile Property/Vehicle Fires
- 4876.4%Other
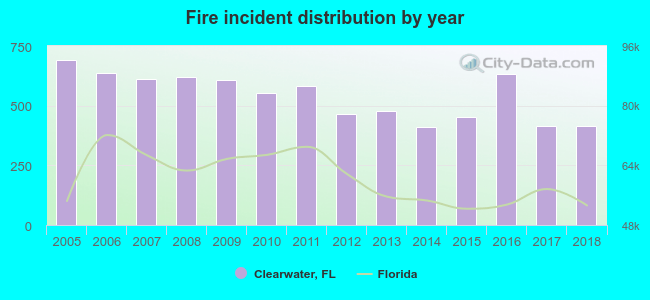 According to the data from the years 2005 - 2018 the average number of fires per year is 541. The highest number of fires - 693 took place in 2005, and the least - 409 in 2014. The data has a declining trend.
The average number of yearly fire incidents per 10k residents in Clearwater, FL compared to nearest cities:
(Note: Based on data for the last 3 years, including only cities with population 5,000 and above)
| Clearwater: | 44.1 |
| Dunedin: | 21.9 |
| Largo: | 32.8 |
| Safety Harbor: | 19.7 |
| Oldsmar: | 49.8 |
| Palm Harbor: | 25.8 |
| Pinellas Park: | 38.7 |
| Seminole: | 58.6 |
| East Lake: | 0.3 |
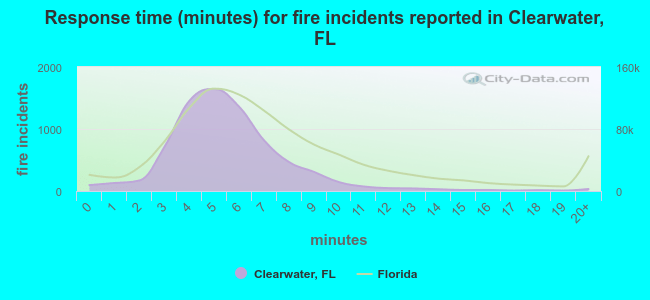 The median response time based on all reported fire incidents is 5 minutes. This is lower than the Florida median value.
The median response time in Clearwater, FL compared to nearest cities:
(Note: Based on data for all years, including only cities with at least 500 fire incidents)
| Clearwater: | 5 minutes |
| Dunedin: | 5 minutes |
| Largo: | 5 minutes |
| Safety Harbor: | 5 minutes |
| Oldsmar: | 6 minutes |
| Palm Harbor: | 6 minutes |
| Pinellas Park: | 5 minutes |
| Seminole: | 5 minutes |
| Lealman: | 5 minutes |
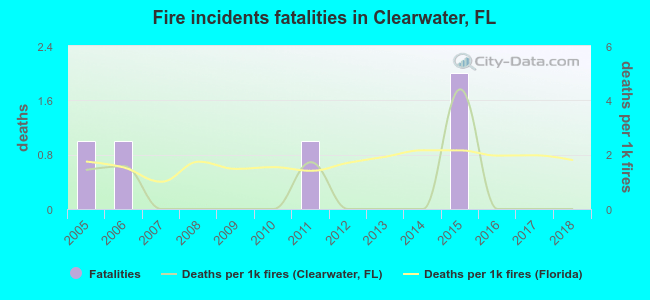 Based on the reports from the years 2005 - 2018 the average number of fire-related yearly deaths is 0. The highest number of deaths - 2 took place in 2015, and the lowest - 0 in 2007. The data has a decreasing trend.
The average number of deaths per 1,000 fires is 1. This indicator was the highest - 4 in 2015, and the lowest 0 in 2007. The trend for deaths per 1,000 fire incidents is declining. Compared to the Florida value the number of fatalities per 1,000 fire incidents is much lower.
Based on the reports from the years 2005 - 2018 the average number of fire-related yearly deaths is 0. The highest number of deaths - 2 took place in 2015, and the lowest - 0 in 2007. The data has a decreasing trend.
The average number of deaths per 1,000 fires is 1. This indicator was the highest - 4 in 2015, and the lowest 0 in 2007. The trend for deaths per 1,000 fire incidents is declining. Compared to the Florida value the number of fatalities per 1,000 fire incidents is much lower.Deaths per 1,000 incidents in Clearwater, FL compared to nearest cities:
(Note: Based on data for all years, including only cities with at least 2,500 fire incidents)
| Clearwater: | 0.7 |
| Largo: | 2.0 |
| Pinellas Park: | 2.3 |
| St. Petersburg: | 0.9 |
| Tampa: | 2.0 |
| New Port Richey: | 2.9 |
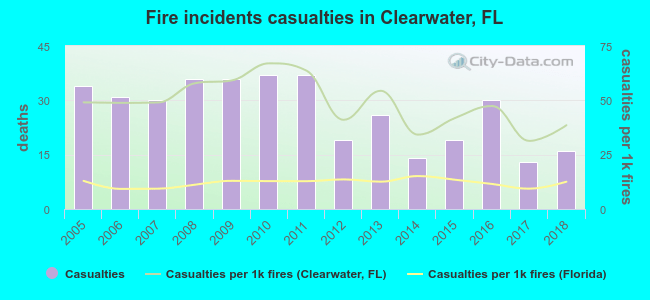 According to the reports from the years 2005 - 2018 the average number of fire-related casualties per year is 27. The highest number of casualties - 37 took place in 2010, and the lowest - 13 in 2017. The data has a decreasing trend.
The average number of injuries per 1,000 fires is 49. This indicator was the highest - 67 in 2010, and the lowest 31 in 2017. The trend for injuries per 1,000 fires is declining. Compared to the Florida value the number of casualties per 1,000 incidents is much higher.
According to the reports from the years 2005 - 2018 the average number of fire-related casualties per year is 27. The highest number of casualties - 37 took place in 2010, and the lowest - 13 in 2017. The data has a decreasing trend.
The average number of injuries per 1,000 fires is 49. This indicator was the highest - 67 in 2010, and the lowest 31 in 2017. The trend for injuries per 1,000 fires is declining. Compared to the Florida value the number of casualties per 1,000 incidents is much higher.Casualties per 1,000 incidents in Clearwater, FL compared to nearest cities:
(Note: Based on data for all years, including only cities with at least 500 fire incidents)
| Clearwater: | 49.9 |
| Dunedin: | 55.1 |
| Largo: | 89.9 |
| Safety Harbor: | 48.0 |
| Oldsmar: | 11.4 |
| Palm Harbor: | 47.8 |
| Pinellas Park: | 48.9 |
| Seminole: | 42.7 |
| Lealman: | 48.5 |
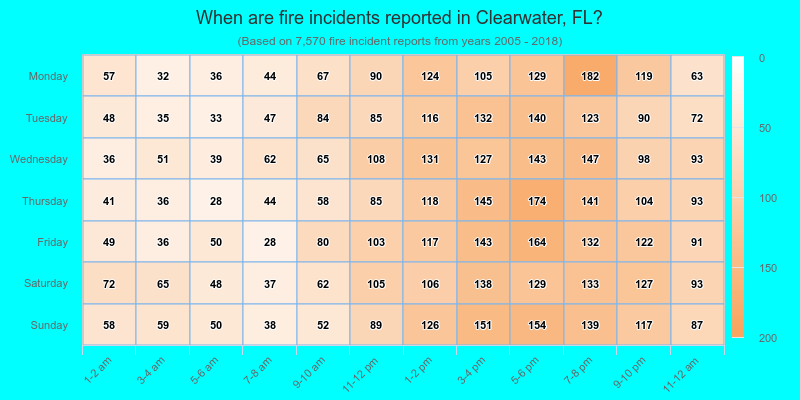
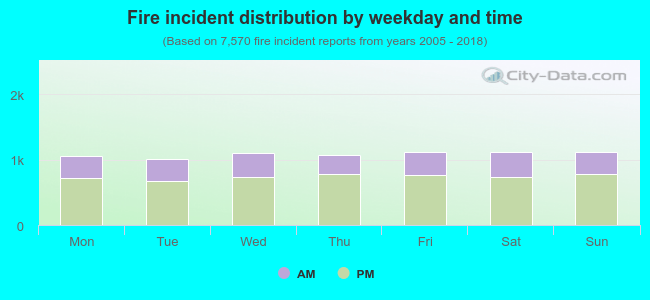 31.6% incidents where reported in the morning and 68.4% in the evening. The most fires (14.8%) took place on Sunday, and the least (13.3%) on Tuesday.
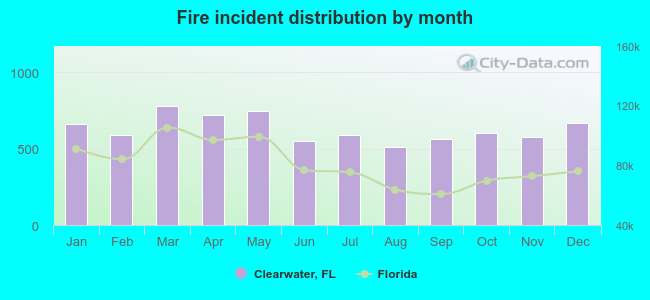 According to the 7,570 reports from years 2005 - 2018 most fires (10.3%) took place during March, and the least (6.8%) in August.
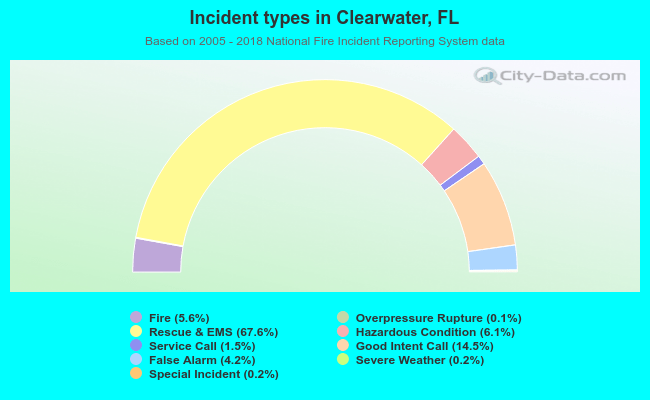 Out of all 134,244 cases reported during the years 2005 - 2018, the most belonged to the categories: Rescue & EMS (67.6%), Good Intent Call (14.5%), and Hazardous Condition (6.1%).
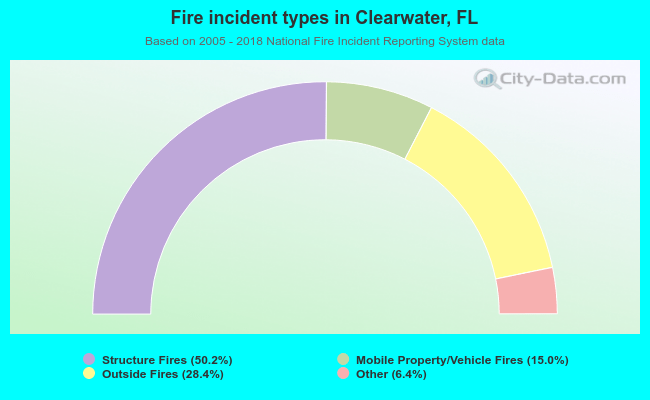 When looking into fire subcategories, the most reports belonged to: Structure Fires (50.2%), and Outside Fires (28.4%).