Oldsmar: Fire Incidents, Florida (FL)
Where are fire incidents reported in Oldsmar, FL
Something went wrong! Please refresh the page.
| Fire incidents reported | |
|---|---|
| Sreet name | Count |
| TAMPA RD | 262 |
| EAST LAKE CLUB DR | 100 |
| OLD VILLAGE WAY | 64 |
| FOREST LAKES BLVD | 56 |
| LAFAYETTE BLVD | 52 |
| BUCKINGHAM AVE | 44 |
| TIMBER BAY CIR | 44 |
| WESTMINSTER BLVD | 44 |
| DOUGLAS RD | 38 |
| SHORE DR | 38 |
| PHOENIX AVE | 32 |
| COMMERCE BLVD | 30 |
| ST PETERSBURG DR | 28 |
| AZALEA CT | 24 |
| CUTTY BAY CT | 24 |
| EAST LAKE WOODLANDS PKWY | 24 |
| LEXINGTON ST | 24 |
| PINE AVE | 24 |
| RACETRACK RD | 24 |
| ST CLAIR AVE | 24 |
| TAMPA RD-OL | 24 |
| COUNTRY CLUB DR | 22 |
| COUNTRYSIDE KEY BLVD | 22 |
| DUNBAR AVE | 22 |
| MERIDEN AVE | 22 |
| BLUE MARLIN DR | 18 |
| BROOKER CREEK BLVD | 18 |
| MAPLELEAF BLVD | 18 |
| MONTEGO CT | 18 |
| BAYVIEW BLVD | 16 |
2005 - 2018 National Fire Incident Reporting System (NFIRS) incidents
- Incident types reported to NFIRS in Oldsmar, FL
- 5,49856.1%Rescue & EMS
- 1,59816.3%Good Intent Call
- 1,05210.7%Fire
- 8328.5%Hazardous Condition
- 5765.9%False Alarm
- 2032.1%Service Call
- 150.2%Severe Weather
- 120.1%Overpressure Rupture
- 100.1%Special Incident
- Fire incident types reported to NFIRS in Oldsmar, FL
- 54852.1%Structure Fires
- 26925.6%Outside Fires
- 12311.7%Other
- 11210.6%Mobile Property/Vehicle Fires
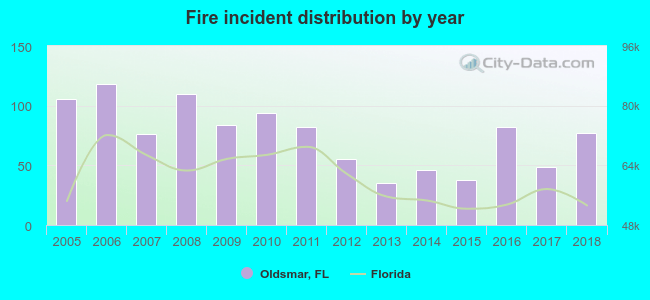 Based on the data from the years 2005 - 2018 the average number of fires per year is 75. The highest number of reported fires - 118 took place in 2006, and the least - 35 in 2013. The data has a dropping trend.
The average number of yearly fire incidents per 10k residents in Oldsmar, FL compared to nearest cities:
(Note: Based on data for the last 3 years, including only cities with population 5,000 and above)
| Oldsmar: | 49.8 |
| Safety Harbor: | 19.7 |
| East Lake: | 0.3 |
| Palm Harbor: | 25.8 |
| Dunedin: | 21.9 |
| Clearwater: | 44.1 |
| Keystone: | 0.4 |
| Tarpon Springs: | 50.2 |
| Trinity: | 3.7 |
 The median response time based on all reported fire incidents is 6 minutes. This is close to the state median value.
The median response time in Oldsmar, FL compared to nearest cities:
(Note: Based on data for all years, including only cities with at least 500 fire incidents)
| Oldsmar: | 6 minutes |
| Safety Harbor: | 5 minutes |
| Palm Harbor: | 6 minutes |
| Dunedin: | 5 minutes |
| Clearwater: | 5 minutes |
| Tarpon Springs: | 6 minutes |
| Holiday: | 6 minutes |
| Largo: | 5 minutes |
| Pinellas Park: | 5 minutes |
 According to the data from the years 2005 - 2018 the average number of fire-related yearly casualties is 1. The highest number of injuries - 4 took place in 2007, and the lowest - 0 in 2005. The data has an increasing trend.
The average number of casualties per 1,000 fire incidents is 13. This indicator was the highest - 57 in 2013, and the lowest 0 in 2005. The trend for casualties per 1,000 fire incidents is growing. Compared to the Florida value the number of injuries per 1,000 fires is similar.
According to the data from the years 2005 - 2018 the average number of fire-related yearly casualties is 1. The highest number of injuries - 4 took place in 2007, and the lowest - 0 in 2005. The data has an increasing trend.
The average number of casualties per 1,000 fire incidents is 13. This indicator was the highest - 57 in 2013, and the lowest 0 in 2005. The trend for casualties per 1,000 fire incidents is growing. Compared to the Florida value the number of injuries per 1,000 fires is similar.Casualties per 1,000 incidents in Oldsmar, FL compared to nearest cities:
(Note: Based on data for all years, including only cities with at least 500 fire incidents)
| Oldsmar: | 11.4 |
| Safety Harbor: | 48.0 |
| Palm Harbor: | 47.8 |
| Dunedin: | 55.1 |
| Clearwater: | 49.9 |
| Tarpon Springs: | 26.3 |
| Holiday: | 46.5 |
| Largo: | 89.9 |
| Pinellas Park: | 48.9 |
 27.9% incidents where reported in the morning and 72.1% in the evening. The most fires (19.2%) took place on Sunday, and the least (11.3%) on Thursday.
 Based on the 1,052 fire incident reports from years 2005 - 2018 most fires (10.6%) took place during May, and the least (6.0%) in November.
 Out of all 9,796 cases reported during the years 2005 - 2018, the most belonged to the categories: Rescue & EMS (56.1%), Good Intent Call (16.3%), and Fire (10.7%).
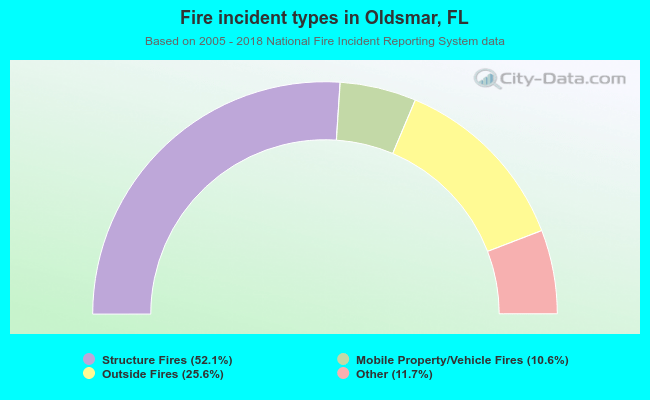 When looking into fire subcategories, the most reports belonged to: Structure Fires (52.1%), and Outside Fires (25.6%).