Odessa: Fire Incidents, Florida (FL)
Where are fire incidents reported in Odessa, FL
Something went wrong! Please refresh the page.
|
| |||||||||||||||||||||||||||||||||||||||||||||||||||||||||||||||||||||||||||||||||||||||||||||||||||||||||||||
2002 - 2018 National Fire Incident Reporting System (NFIRS) incidents
- Incident types reported to NFIRS in Odessa, FL
- 2,51061.9%Rescue & EMS
- 3839.4%Service Call
- 3659.0%Good Intent Call
- 2816.9%Hazardous Condition
- 2566.3%Fire
- 2466.1%False Alarm
- 60.1%Overpressure Rupture
- 60.1%Severe Weather
- 50.1%Special Incident
- Fire incident types reported to NFIRS in Odessa, FL
- 10842.2%Outside Fires
- 6726.2%Structure Fires
- 6425.0%Mobile Property/Vehicle Fires
- 176.6%Other
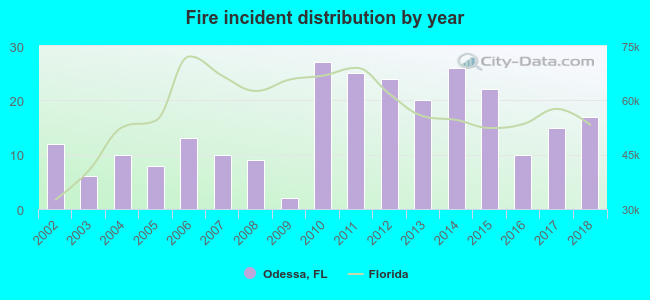 Based on the data from the years 2002 - 2018 the average number of fires per year is 15. The highest number of reported fires - 27 took place in 2010, and the least - 2 in 2009. The data has a growing trend.
The average number of yearly fire incidents per 10k residents in Odessa, FL compared to nearest cities:
(Note: Based on data for the last 3 years, including only cities with population 5,000 and above)
| Odessa: | 19.3 |
| Keystone: | 0.4 |
| Trinity: | 3.7 |
| Lutz: | 14.8 |
| East Lake: | 0.3 |
| New Port Richey: | 151.1 |
| Holiday: | 35.6 |
| Oldsmar: | 49.8 |
| Tarpon Springs: | 50.2 |

 According to the data from the years 2002 - 2018 the average number of fire-related yearly deaths is 0. The highest number of reported deaths - 2 took place in 2004, and the lowest - 0 in 2002. The data has a constant trend.
 According to the reports from the years 2002 - 2018 the average number of fire-related casualties per year is 0. The highest number of reported injuries - 2 took place in 2011, and the lowest - 0 in 2002. The data has a constant trend.
 35.2% incidents where reported in the morning and 64.8% in the evening. The most fires (18.4%) took place on Sunday, and the least (10.2%) on Wednesday.
 According to the 256 fire incident reports from years 2002 - 2018 most fires (12.9%) took place during May, and the least (4.3%) in July.
 Out of all 4,058 cases reported during the years 2002 - 2018, the most belonged to the categories: Rescue & EMS (61.9%), Service Call (9.4%), and Good Intent Call (9.0%).
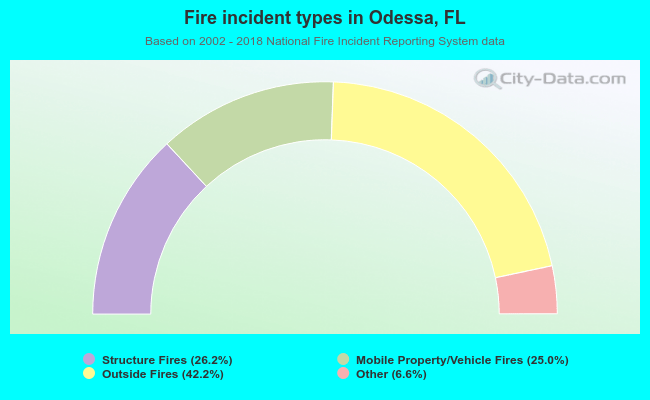 When looking into fire subcategories, the most reports belonged to: Outside Fires (42.2%), and Structure Fires (26.2%).