Lutz: Fire Incidents, Florida (FL)
Where are fire incidents reported in Lutz, FL
Something went wrong! Please refresh the page.
|
| |||||||||||||||||||||||||||||||||||||||||||||||||||||||||||||||||||||||||||||||||||||||||||||||||||||||||||||
| Other | 55 | |||||||||||||||||||||||||||||||||||||||||||||||||||||||||||||||||||||||||||||||||||||||||||||||||||||||||||||
2002 - 2018 National Fire Incident Reporting System (NFIRS) incidents
- Incident types reported to NFIRS in Lutz, FL
- 11,13477.8%Rescue & EMS
- 9946.9%Good Intent Call
- 7245.1%Service Call
- 5573.9%Fire
- 4703.3%Hazardous Condition
- 3822.7%False Alarm
- 320.2%Special Incident
- Fire incident types reported to NFIRS in Lutz, FL
- 24644.2%Outside Fires
- 19034.1%Structure Fires
- 10318.5%Mobile Property/Vehicle Fires
- 183.2%Other
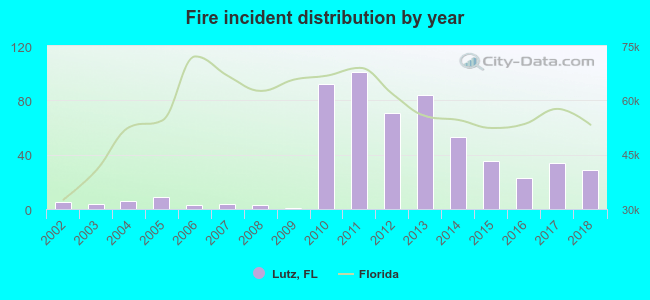 Based on the data from the years 2002 - 2018 the average number of fire incidents per year is 33. The highest number of fire incidents - 101 took place in 2011, and the least - 1 in 2009. The data has a growing trend.
The average number of yearly fire incidents per 10k residents in Lutz, FL compared to nearest cities:
(Note: Based on data for the last 3 years, including only cities with population 5,000 and above)
| Lutz: | 14.8 |
| Odessa: | 19.3 |
| Wesley Chapel: | 20.4 |
| Keystone: | 0.4 |
| Temple Terrace: | 16.8 |
| Tampa: | 38.7 |
| Thonotosassa: | 10.4 |
| Trinity: | 3.7 |
| East Lake: | 0.3 |
 The median response time based on all reported fire incidents is 9 minutes. This is higher compared to the state median value.
The median response time in Lutz, FL compared to nearest cities:
(Note: Based on data for all years, including only cities with at least 500 fire incidents)
| Lutz: | 9 minutes |
| Wesley Chapel: | 8 minutes |
| Temple Terrace: | 5 minutes |
| Tampa: | 7 minutes |
| Oldsmar: | 6 minutes |
| Seffner: | 8 minutes |
| Safety Harbor: | 5 minutes |
| New Port Richey: | 6 minutes |
| Holiday: | 6 minutes |
 According to the reports from the years 2002 - 2018 the average number of fire-related casualties per year is 0. The highest number of reported injuries - 3 took place in 2011, and the lowest - 0 in 2002. The data has a constant trend.
The average number of injuries per 1,000 fires is 6. This indicator was the highest - 38 in 2014, and the lowest 0 in 2002. The trend for injuries per 1,000 fire incidents is constant. Compared to the state value the number of casualties per 1,000 incidents is similar.
According to the reports from the years 2002 - 2018 the average number of fire-related casualties per year is 0. The highest number of reported injuries - 3 took place in 2011, and the lowest - 0 in 2002. The data has a constant trend.
The average number of injuries per 1,000 fires is 6. This indicator was the highest - 38 in 2014, and the lowest 0 in 2002. The trend for injuries per 1,000 fire incidents is constant. Compared to the state value the number of casualties per 1,000 incidents is similar.Casualties per 1,000 incidents in Lutz, FL compared to nearest cities:
(Note: Based on data for all years, including only cities with at least 500 fire incidents)
| Lutz: | 12.6 |
| Wesley Chapel: | 28.4 |
| Temple Terrace: | 25.2 |
| Tampa: | 9.8 |
| Oldsmar: | 11.4 |
| Seffner: | 9.5 |
| Safety Harbor: | 48.0 |
| New Port Richey: | 25.6 |
| Holiday: | 46.5 |
 29.3% incidents where reported in the morning and 70.7% in the evening. The most fires (17.2%) took place on Sunday, and the least (12.2%) on Thursday.
 Based on the 557 fire incident reports from years 2002 - 2018 most fires (15.1%) took place during January, and the least (5.0%) in October.
 Out of all 14,314 cases reported during the years 2002 - 2018, the most belonged to the categories: Rescue & EMS (77.8%), Good Intent Call (6.9%), and Service Call (5.1%).
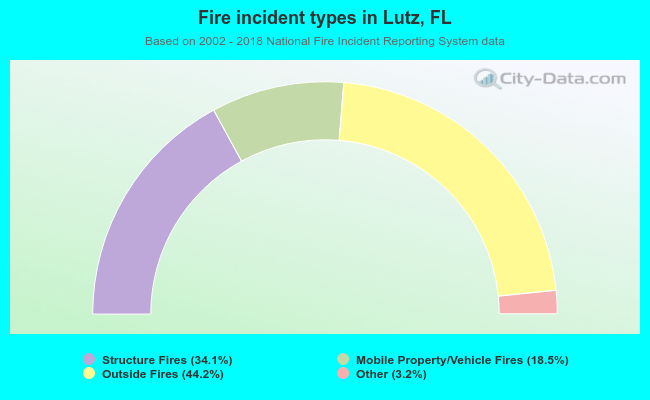 When looking into fire subcategories, the most reports belonged to: Outside Fires (44.2%), and Structure Fires (34.1%).