Temple Terrace: Fire Incidents, Florida (FL)
Where are fire incidents reported in Temple Terrace, FL
Something went wrong! Please refresh the page.
| Fire incidents reported | |
|---|---|
| Sreet name | Count |
| 56TH ST | 240 |
| FOWLER AVE | 128 |
| RIVERHILLS DR | 62 |
| SUMMIT WEST BLVD | 56 |
| 53RD ST | 52 |
| MUTUAL AID TO COUNTY | 44 |
| 52ND ST | 40 |
| BUSCH BLVD | 40 |
| MORRIS BRIDGE RD | 38 |
| TEMPLE TERRACE HWY | 32 |
| BOARDWALK TRAIL DR | 26 |
| OVERLOOK DR | 24 |
| TELECOM DR | 24 |
| WHITEWAY DR | 24 |
| BULLARD PKY | 22 |
| NORMANDY CIR | 22 |
| SANCTUARY COVE DR | 22 |
| TELECOM PKY | 22 |
| DORAL OAKS DR | 20 |
| FLETCHER AVE | 18 |
| GROVE TER | 18 |
| HERITAGE HILLS DR | 18 |
| TERRACE CT | 18 |
| GRADUATE CIR | 16 |
| TANGLEWOOD PL | 16 |
| 112TH AVE | 14 |
| GLEN ARVEN AVE | 14 |
| GULF CT | 14 |
| RIDGEDALE RD | 14 |
| RIVERCHASE DR | 14 |
2002 - 2018 National Fire Incident Reporting System (NFIRS) incidents
- Incident types reported to NFIRS in Temple Terrace, FL
- 13,28965.7%Rescue & EMS
- 2,0099.9%False Alarm
- 1,4036.9%Service Call
- 1,3336.6%Hazardous Condition
- 1,1025.4%Good Intent Call
- 1,0735.3%Fire
- Fire incident types reported to NFIRS in Temple Terrace, FL
- 52949.3%Structure Fires
- 30528.4%Outside Fires
- 21019.6%Mobile Property/Vehicle Fires
- 292.7%Other
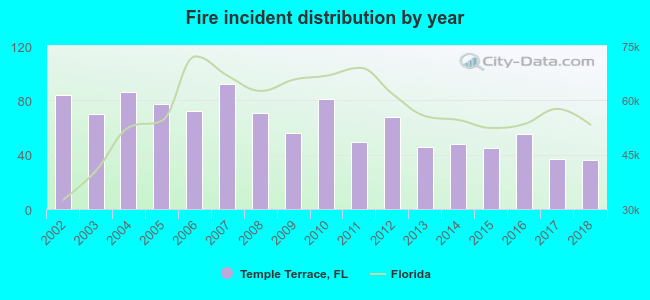 Based on the data from the years 2002 - 2018 the average number of fires per year is 63. The highest number of reported fires - 92 took place in 2007, and the least - 36 in 2018. The data has a decreasing trend.
The average number of yearly fire incidents per 10k residents in Temple Terrace, FL compared to nearest cities:
(Note: Based on data for the last 3 years, including only cities with population 5,000 and above)
| Temple Terrace: | 16.8 |
| Thonotosassa: | 10.4 |
| Tampa: | 38.7 |
| Seffner: | 10.6 |
| Lutz: | 14.8 |
| Brandon: | 3.5 |
| Wesley Chapel: | 20.4 |
| Valrico: | 7.3 |
| Riverview: | 4.0 |
 The median response time based on all reported fire incidents is 5 minutes. This is lower compared to the state median value.
The median response time in Temple Terrace, FL compared to nearest cities:
(Note: Based on data for all years, including only cities with at least 500 fire incidents)
| Temple Terrace: | 5 minutes |
| Tampa: | 7 minutes |
| Seffner: | 8 minutes |
| Lutz: | 9 minutes |
| Brandon: | 8 minutes |
| Wesley Chapel: | 8 minutes |
| Riverview: | 9 minutes |
| Plant City: | 6 minutes |
| Oldsmar: | 6 minutes |
 According to the data from the years 2002 - 2018 the average number of fire-related yearly casualties is 2. The highest number of injuries - 6 took place in 2002, and the lowest - 0 in 2013. The data has a declining trend.
The average number of injuries per 1,000 fires is 22. This indicator was the highest - 71 in 2002, and the lowest 0 in 2013. The trend for casualties per 1,000 incidents is decreasing. Compared to the Florida value the number of injuries per 1,000 incidents is much higher.
According to the data from the years 2002 - 2018 the average number of fire-related yearly casualties is 2. The highest number of injuries - 6 took place in 2002, and the lowest - 0 in 2013. The data has a declining trend.
The average number of injuries per 1,000 fires is 22. This indicator was the highest - 71 in 2002, and the lowest 0 in 2013. The trend for casualties per 1,000 incidents is decreasing. Compared to the Florida value the number of injuries per 1,000 incidents is much higher.Casualties per 1,000 incidents in Temple Terrace, FL compared to nearest cities:
(Note: Based on data for all years, including only cities with at least 500 fire incidents)
| Temple Terrace: | 25.2 |
| Tampa: | 9.8 |
| Seffner: | 9.5 |
| Lutz: | 12.6 |
| Brandon: | 22.0 |
| Wesley Chapel: | 28.4 |
| Riverview: | 16.3 |
| Plant City: | 26.6 |
| Oldsmar: | 11.4 |
 27.1% incidents where reported in the morning and 72.9% in the evening. The most fires (17.0%) took place on Sunday, and the least (11.7%) on Thursday.
 According to the 1,073 fires from years 2002 - 2018 most fires (11.5%) took place during May, and the least (6.6%) in February.
 Out of all 20,230 cases reported during the years 2002 - 2018, the most belonged to the categories: Rescue & EMS (65.7%), False Alarm (9.9%), and Service Call (6.9%).
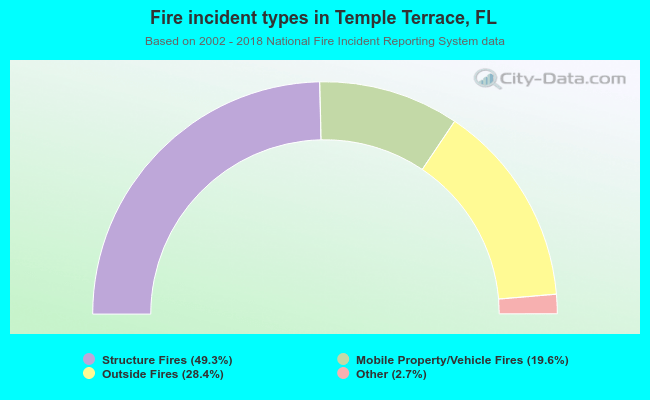 When looking into fire subcategories, the most reports belonged to: Structure Fires (49.3%), and Outside Fires (28.4%).