Plant City: Fire Incidents, Florida (FL)
Where are fire incidents reported in Plant City, FL
Something went wrong! Please refresh the page.
| Fire incidents reported | |
|---|---|
| Sreet name | Count |
| ALEXANDER ST | 220 |
| INTERSTATE 4 | 190 |
| TURKEY CREEK RD | 150 |
| PARK RD | 120 |
| BAKER ST | 118 |
| FRONTAGE RD | 102 |
| JAMES L REDMAN PKY | 98 |
| REYNOLDS ST | 96 |
| JAMES L REDMAN PKWY | 94 |
| COLLINS ST | 80 |
| KNIGHTS GRIFFIN RD | 76 |
| THONOTOSASSA RD | 74 |
| MARYLAND AVE | 72 |
| BALL ST | 70 |
| WHEELER ST | 70 |
| TRAPNELL RD | 56 |
| I4 | 54 |
| SYDNEY RD | 54 |
| GORDON ST | 52 |
| COUNTY LINE RD | 50 |
| WARREN ST | 50 |
| ALABAMA ST | 48 |
| ALSOBROOK ST | 48 |
| FRANKLIN ST | 48 |
| MAKI RD | 48 |
| HENDERSON WAY | 46 |
| CALHOUN ST | 44 |
| JAMES REDMAN PKWY LN | 44 |
| WILDER RD | 44 |
| AIRPORT RD | 40 |
| Other | 1,146 |
2002 - 2018 National Fire Incident Reporting System (NFIRS) incidents
- Incident types reported to NFIRS in Plant City, FL
- 26,13468.9%Rescue & EMS
- 3,5029.2%Fire
- 2,5976.9%Good Intent Call
- 1,9985.3%Service Call
- 1,8184.8%Hazardous Condition
- 1,6694.4%False Alarm
- 1410.4%Special Incident
- Fire incident types reported to NFIRS in Plant City, FL
- 1,78350.9%Outside Fires
- 90525.8%Structure Fires
- 71920.5%Mobile Property/Vehicle Fires
- 952.7%Other
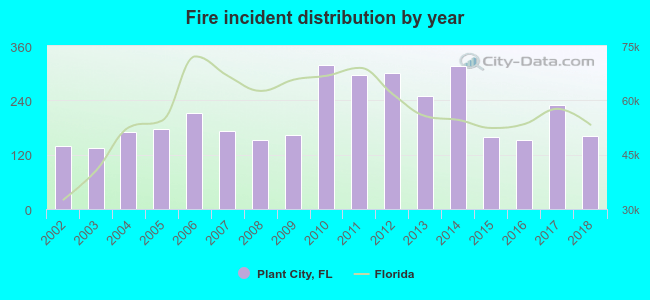 Based on the data from the years 2002 - 2018 the average number of fires per year is 206. The highest number of reported fire incidents - 317 took place in 2010, and the least - 135 in 2003. The data has a rising trend.
The average number of yearly fire incidents per 10k residents in Plant City, FL compared to nearest cities:
(Note: Based on data for the last 3 years, including only cities with population 5,000 and above)
| Plant City: | 49.4 |
| Valrico: | 7.3 |
| Seffner: | 10.6 |
| Kathleen: | 1.6 |
| Thonotosassa: | 10.4 |
| Lakeland: | 72.9 |
| Brandon: | 3.5 |
| Bloomingdale: | 1.8 |
| Riverview: | 4.0 |
 The median response time based on all reported fire incidents is 6 minutes. This is similar to the Florida median value.
The median response time in Plant City, FL compared to nearest cities:
(Note: Based on data for all years, including only cities with at least 500 fire incidents)
| Plant City: | 6 minutes |
| Seffner: | 8 minutes |
| Lakeland: | 8 minutes |
| Brandon: | 8 minutes |
| Mulberry: | 9 minutes |
| Riverview: | 9 minutes |
| Temple Terrace: | 5 minutes |
| Zephyrhills: | 7 minutes |
| Wesley Chapel: | 8 minutes |
 According to the reports from the years 2002 - 2018 the average number of fire-related fatalities per year is 1. The highest number of reported deaths - 2 took place in 2005, and the lowest - 0 in 2002. The data has a growing trend.
The average number of fatalities per 1,000 fire incidents is 3. This indicator was the highest - 13 in 2016, and the lowest 0 in 2002. The trend for deaths per 1,000 incidents is growing. Compared to the state value the number of deaths per 1,000 fires is higher.
According to the reports from the years 2002 - 2018 the average number of fire-related fatalities per year is 1. The highest number of reported deaths - 2 took place in 2005, and the lowest - 0 in 2002. The data has a growing trend.
The average number of fatalities per 1,000 fire incidents is 3. This indicator was the highest - 13 in 2016, and the lowest 0 in 2002. The trend for deaths per 1,000 incidents is growing. Compared to the state value the number of deaths per 1,000 fires is higher.Deaths per 1,000 incidents in Plant City, FL compared to nearest cities:
(Note: Based on data for all years, including only cities with at least 2,500 fire incidents)
| Plant City: | 2.6 |
| Lakeland: | 2.0 |
| Bartow: | 3.4 |
| Tampa: | 2.0 |
| Winter Haven: | 2.4 |
 According to the reports from the years 2002 - 2018 the average number of fire-related casualties per year is 5. The highest number of injuries - 18 took place in 2004, and the lowest - 1 in 2018. The data has a dropping trend.
The average number of casualties per 1,000 fire incidents is 28. This indicator was the highest - 105 in 2004, and the lowest 6 in 2018. The trend for injuries per 1,000 fire incidents is declining. Compared to the state value the number of injuries per 1,000 incidents is much higher.
According to the reports from the years 2002 - 2018 the average number of fire-related casualties per year is 5. The highest number of injuries - 18 took place in 2004, and the lowest - 1 in 2018. The data has a dropping trend.
The average number of casualties per 1,000 fire incidents is 28. This indicator was the highest - 105 in 2004, and the lowest 6 in 2018. The trend for injuries per 1,000 fire incidents is declining. Compared to the state value the number of injuries per 1,000 incidents is much higher.Casualties per 1,000 incidents in Plant City, FL compared to nearest cities:
(Note: Based on data for all years, including only cities with at least 500 fire incidents)
| Plant City: | 26.6 |
| Seffner: | 9.5 |
| Lakeland: | 17.2 |
| Brandon: | 22.0 |
| Mulberry: | 7.0 |
| Riverview: | 16.3 |
| Temple Terrace: | 25.2 |
| Zephyrhills: | 26.0 |
| Wesley Chapel: | 28.4 |
 30.5% incidents where reported in the morning and 69.5% in the evening. The most fires (16.1%) took place on Saturday, and the least (12.8%) on Wednesday.
 Based on the 3,502 fire incident reports from years 2002 - 2018 most fires (11.3%) took place during May, and the least (5.7%) in September.
 Out of all 37,906 cases reported during the years 2002 - 2018, the most belonged to the categories: Rescue & EMS (68.9%), Fire (9.2%), and Good Intent Call (6.9%).
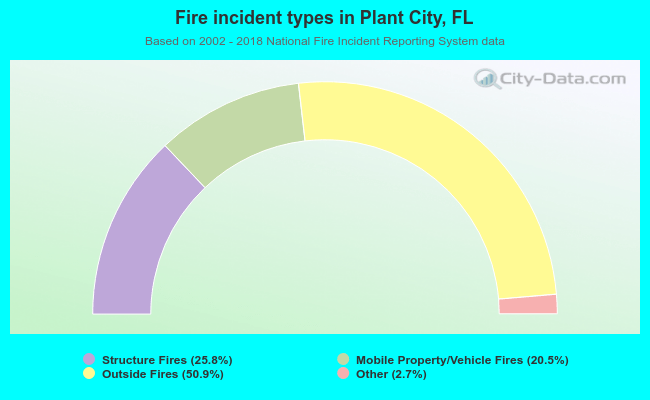 When looking into fire subcategories, the most reports belonged to: Outside Fires (50.9%), and Structure Fires (25.8%).