Zephyrhills: Fire Incidents, Florida (FL)
Where are fire incidents reported in Zephyrhills, FL
Something went wrong! Please refresh the page.
| Fire incidents reported | |
|---|---|
| Sreet name | Count |
| GALL BLVD | 268 |
| CHANCEY RD | 96 |
| 20TH ST | 54 |
| SOUTH AVE | 42 |
| 5TH AVE | 40 |
| SR 54 | 38 |
| 12TH ST | 36 |
| TUCKER RD | 36 |
| CR 54 HY | 34 |
| DAUGHTERY RD | 30 |
| FORT KING RD | 30 |
| SR 54 HWY | 30 |
| 5TH ST | 28 |
| STATE ROAD 54 | 28 |
| 8TH ST | 26 |
| LANE RD | 26 |
| EILAND BLVD | 24 |
| SIMONS RD | 24 |
| 23RD ST | 22 |
| DAIRY RD | 22 |
| GALL BL | 22 |
| MORRIS BRIDGE RD | 22 |
| NORTH AV | 22 |
| STEWART RD | 22 |
| WIRE RD | 22 |
| 10TH ST | 20 |
| 16TH ST | 20 |
| 18TH ST | 20 |
| 6TH AVE | 20 |
| 9TH ST | 20 |
| Other | 431 |
2002 - 2018 National Fire Incident Reporting System (NFIRS) incidents
- Incident types reported to NFIRS in Zephyrhills, FL
- 28,24373.1%Rescue & EMS
- 4,11010.6%Service Call
- 2,1965.7%Good Intent Call
- 1,6474.3%Hazardous Condition
- 1,5754.1%Fire
- 8192.1%False Alarm
- Fire incident types reported to NFIRS in Zephyrhills, FL
- 61138.8%Outside Fires
- 56035.6%Structure Fires
- 33621.3%Mobile Property/Vehicle Fires
- 684.3%Other
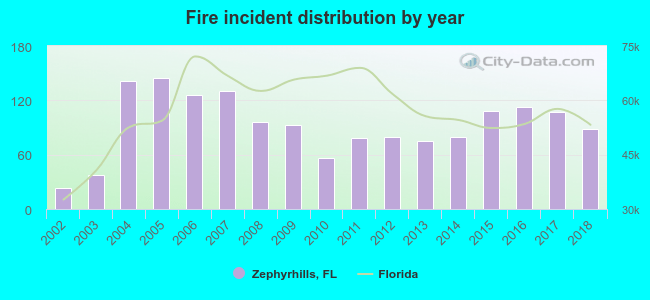 Based on the data from the years 2002 - 2018 the average number of fires per year is 93. The highest number of reported fires - 145 took place in 2005, and the least - 23 in 2002. The data has a rising trend.
The average number of yearly fire incidents per 10k residents in Zephyrhills, FL compared to nearest cities:
(Note: Based on data for the last 3 years, including only cities with population 5,000 and above)
| Zephyrhills: | 71.4 |
| Dade City: | 135.8 |
| Wesley Chapel: | 20.4 |
| Kathleen: | 1.6 |
| Thonotosassa: | 10.4 |
| Plant City: | 49.4 |
| Seffner: | 10.6 |
| Temple Terrace: | 16.8 |
| Lutz: | 14.8 |
 The median response time based on all reported fire incidents is 7 minutes. This is close to the Florida median value.
The median response time in Zephyrhills, FL compared to nearest cities:
(Note: Based on data for all years, including only cities with at least 500 fire incidents)
| Zephyrhills: | 7 minutes |
| Dade City: | 7 minutes |
| Wesley Chapel: | 8 minutes |
| Plant City: | 6 minutes |
| Seffner: | 8 minutes |
| Temple Terrace: | 5 minutes |
| Lutz: | 9 minutes |
| Lakeland: | 8 minutes |
| Polk City: | 11 minutes |
 According to the reports from the years 2002 - 2018 the average number of fire-related yearly deaths is 0. The highest number of deaths - 2 took place in 2006, and the lowest - 0 in 2002. The data has a constant trend.
 Based on the data from the years 2002 - 2018 the average number of fire-related casualties per year is 2. The highest number of casualties - 6 took place in 2015, and the lowest - 0 in 2003. The data has an increasing trend.
The average number of casualties per 1,000 fires is 25. This indicator was the highest - 56 in 2015, and the lowest 0 in 2003. The trend for casualties per 1,000 fires is dropping. Compared to the Florida value the number of injuries per 1,000 incidents is much higher.
Based on the data from the years 2002 - 2018 the average number of fire-related casualties per year is 2. The highest number of casualties - 6 took place in 2015, and the lowest - 0 in 2003. The data has an increasing trend.
The average number of casualties per 1,000 fires is 25. This indicator was the highest - 56 in 2015, and the lowest 0 in 2003. The trend for casualties per 1,000 fires is dropping. Compared to the Florida value the number of injuries per 1,000 incidents is much higher.Casualties per 1,000 incidents in Zephyrhills, FL compared to nearest cities:
(Note: Based on data for all years, including only cities with at least 500 fire incidents)
| Zephyrhills: | 26.0 |
| Dade City: | 10.3 |
| Wesley Chapel: | 28.4 |
| Plant City: | 26.6 |
| Seffner: | 9.5 |
| Temple Terrace: | 25.2 |
| Lutz: | 12.6 |
| Lakeland: | 17.2 |
| Polk City: | 4.9 |
 30.0% incidents where reported in the morning and 70.0% in the evening. The most fires (16.6%) took place on Saturday, and the least (12.3%) on Thursday.
 Based on the 1,575 incident reports from years 2002 - 2018 most fires (12.1%) took place during March, and the least (6.2%) in July.
 Out of all 38,645 cases reported during the years 2002 - 2018, the most belonged to the categories: Rescue & EMS (73.1%), Service Call (10.6%), and Good Intent Call (5.7%).
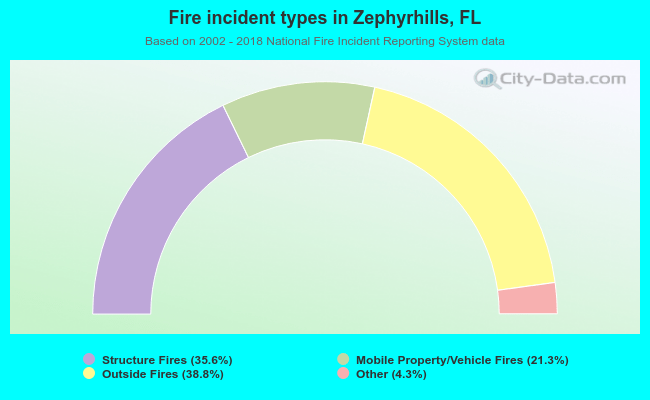 When looking into fire subcategories, the most reports belonged to: Outside Fires (38.8%), and Structure Fires (35.6%).