Riverview: Fire Incidents, Florida (FL)
Where are fire incidents reported in Riverview, FL
Something went wrong! Please refresh the page.
| Fire incidents reported | |
|---|---|
| Sreet name | Count |
| HW | 86 |
| RHODINE RD | 52 |
| 301 HW | 50 |
| 301 HY | 50 |
| BIG BEND RD | 50 |
| BOYETTE RD | 48 |
| BALM RIVERVIEW RD | 40 |
| I75 | 36 |
| I75 MM | 34 |
| 672 HW | 20 |
| RIVERVIEW DR | 20 |
| ENTRANCE WAY | 18 |
| BLOOMINGDALE AVE | 16 |
| ELNORA DR | 16 |
| SYMMES RD | 16 |
| BALM WIMAUMA RD | 14 |
| ZACKARY CR | 14 |
| COWLEY RD | 12 |
| EAGLE PALM DR | 12 |
| FALKENBURG RD | 12 |
| GIBSONTON DR | 12 |
| PROVIDENCE RD | 12 |
| REVELS RD | 12 |
| BALM BOYETTE RD | 10 |
| BULLFROG CREEK RD | 10 |
| FAWN DALE DR | 10 |
| GLENHILL DR | 10 |
| RIVER BREAM DR | 10 |
| SPOTTSWOOD DR | 10 |
| STONER RD | 10 |
| Other | 197 |
2010 - 2018 National Fire Incident Reporting System (NFIRS) incidents
- Incident types reported to NFIRS in Riverview, FL
- 15,86778.2%Rescue & EMS
- 1,8018.9%Good Intent Call
- 9194.5%Fire
- 7333.6%Service Call
- 4792.4%False Alarm
- 4392.2%Hazardous Condition
- 380.2%Special Incident
- Fire incident types reported to NFIRS in Riverview, FL
- 37540.8%Outside Fires
- 30132.8%Structure Fires
- 21323.2%Mobile Property/Vehicle Fires
- 303.3%Other
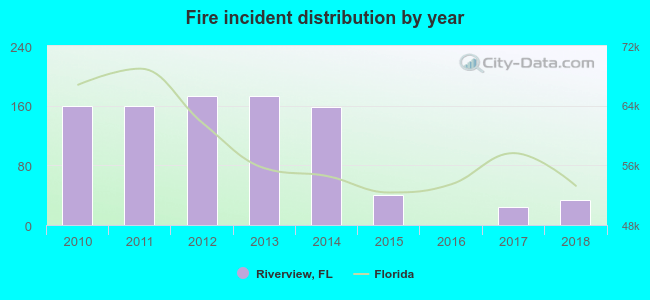 According to the data from the years 2010 - 2018 the average number of fire incidents per year is 102. The highest number of reported fire incidents - 173 took place in 2012, and the least - 0 in 2016. The data has a decreasing trend.
The average number of yearly fire incidents per 10k residents in Riverview, FL compared to nearest cities:
(Note: Based on data for the last 3 years, including only cities with population 5,000 and above)
| Riverview: | 4.0 |
| Bloomingdale: | 1.8 |
| Gibsonton: | 12.3 |
| Brandon: | 3.5 |
| Valrico: | 7.3 |
| Seffner: | 10.6 |
| Apollo Beach: | 4.6 |
| Sun City Center: | 5.7 |
| Tampa: | 38.7 |
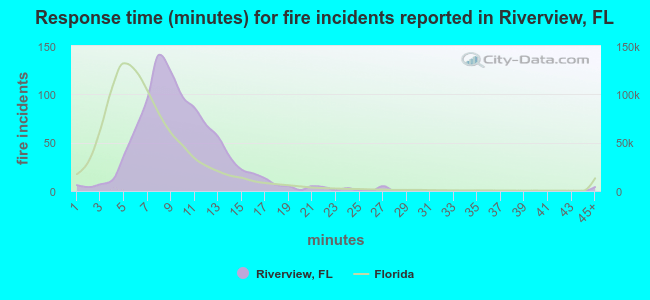 The median response time based on all reported fire incidents is 9 minutes. This is higher than the Florida median value.
The median response time in Riverview, FL compared to nearest cities:
(Note: Based on data for all years, including only cities with at least 500 fire incidents)
| Riverview: | 9 minutes |
| Brandon: | 8 minutes |
| Seffner: | 8 minutes |
| Tampa: | 7 minutes |
| Temple Terrace: | 5 minutes |
| Ruskin: | 10 minutes |
| Plant City: | 6 minutes |
| Lutz: | 9 minutes |
| Parrish: | 6 minutes |
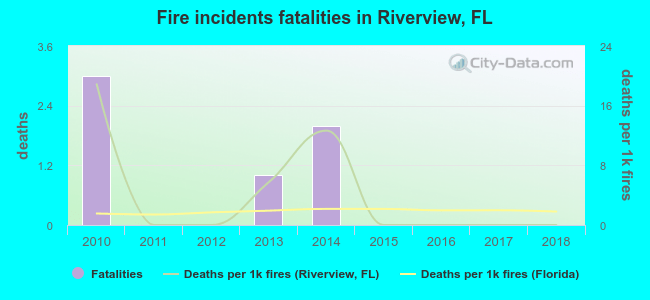 According to the data from the years 2010 - 2018 the average number of fire-related fatalities per year is 1. The highest number of deaths - 3 took place in 2010, and the lowest - 0 in 2011. The data has a declining trend.
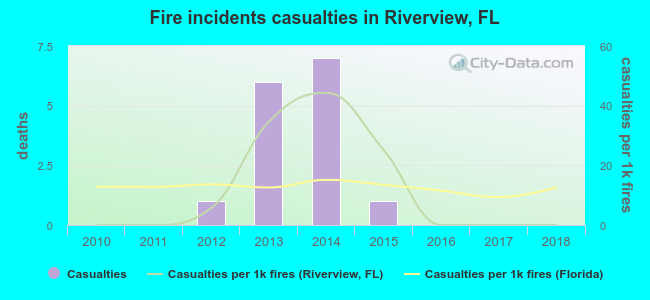 Based on the data from the years 2010 - 2018 the average number of fire-related yearly casualties is 2. The highest number of reported casualties - 7 took place in 2014, and the lowest - 0 in 2010. The data has a constant trend.
The average number of casualties per 1,000 fire incidents is 12. This indicator was the highest - 44 in 2014, and the lowest 0 in 2010. The trend for casualties per 1,000 fires is constant. Compared to the state value the number of injuries per 1,000 fire incidents is higher.
Based on the data from the years 2010 - 2018 the average number of fire-related yearly casualties is 2. The highest number of reported casualties - 7 took place in 2014, and the lowest - 0 in 2010. The data has a constant trend.
The average number of casualties per 1,000 fire incidents is 12. This indicator was the highest - 44 in 2014, and the lowest 0 in 2010. The trend for casualties per 1,000 fires is constant. Compared to the state value the number of injuries per 1,000 fire incidents is higher.Casualties per 1,000 incidents in Riverview, FL compared to nearest cities:
(Note: Based on data for all years, including only cities with at least 500 fire incidents)
| Riverview: | 16.3 |
| Brandon: | 22.0 |
| Seffner: | 9.5 |
| Tampa: | 9.8 |
| Temple Terrace: | 25.2 |
| Ruskin: | 29.8 |
| Plant City: | 26.6 |
| Lutz: | 12.6 |
| Parrish: | 4.6 |
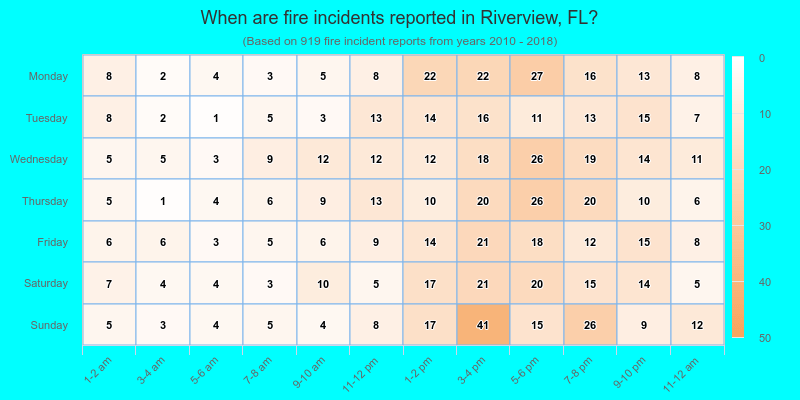
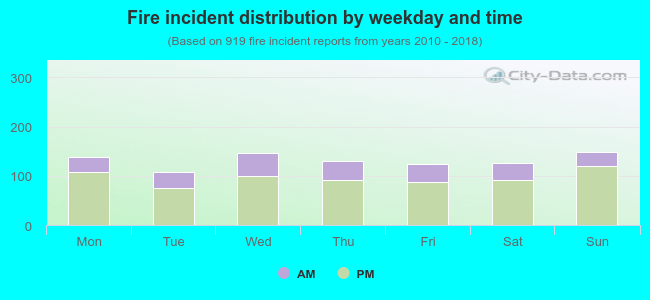 26.4% incidents where reported in the morning and 73.6% in the evening. The most fires (16.2%) took place on Sunday, and the least (11.8%) on Tuesday.
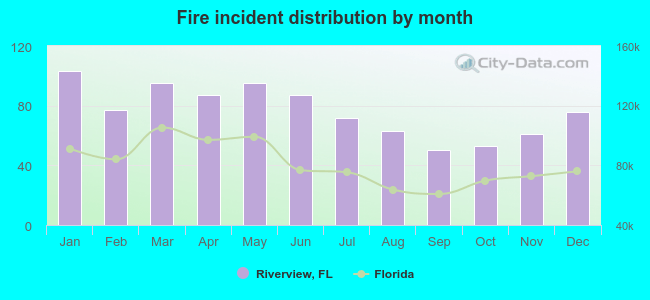 Based on the 919 fire incident reports from years 2010 - 2018 most fires (11.2%) took place during January, and the least (5.4%) in September.
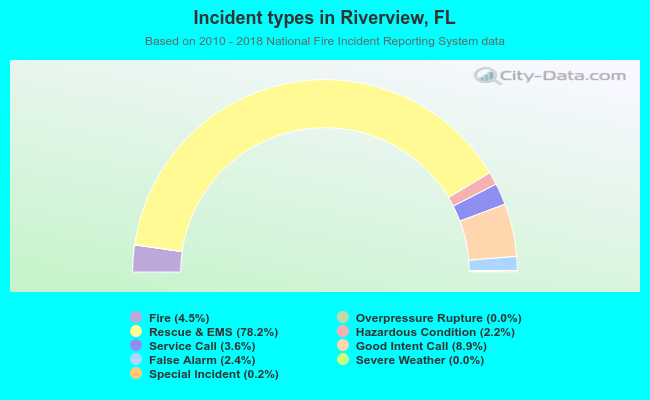 Out of all 20,286 cases reported during the years 2010 - 2018, the most belonged to the categories: Rescue & EMS (78.2%), Good Intent Call (8.9%), and Fire (4.5%).
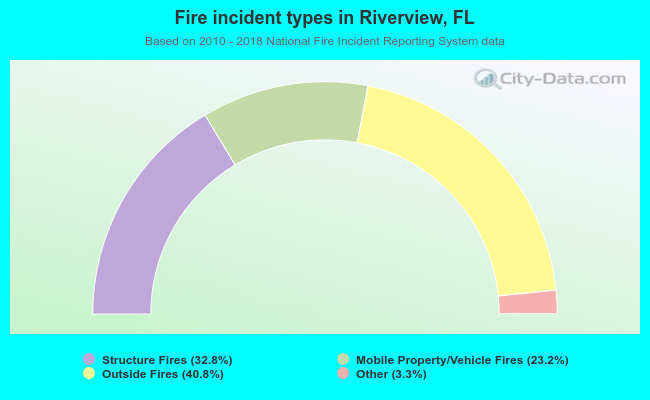 When looking into fire subcategories, the most reports belonged to: Outside Fires (40.8%), and Structure Fires (32.8%).