Bayonet Point: Fire Incidents, Florida (FL)
Where are fire incidents reported in Bayonet Point, FL
Something went wrong! Please refresh the page.
|
| |||||||||||||||||||||||||||||||||||||||||||||||||||||||||||||||||||||||||||||||||||||||||||||||||||||||||||||
2002 - 2018 National Fire Incident Reporting System (NFIRS) incidents
- Incident types reported to NFIRS in Bayonet Point, FL
- 10,94381.0%Rescue & EMS
- 9827.3%Good Intent Call
- 9376.9%Service Call
- 2882.1%False Alarm
- 1701.3%Fire
- 1641.2%Hazardous Condition
- Fire incident types reported to NFIRS in Bayonet Point, FL
- 7544.1%Outside Fires
- 5834.1%Structure Fires
- 3520.6%Mobile Property/Vehicle Fires
- 21.2%Other
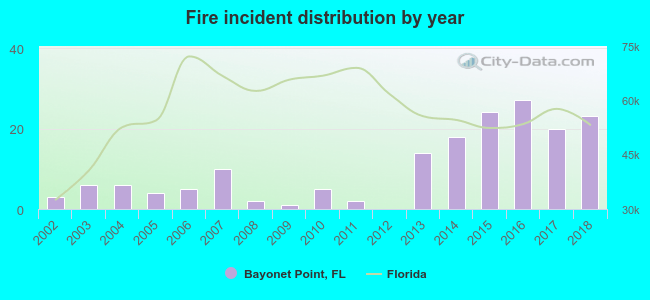 According to the data from the years 2002 - 2018 the average number of fires per year is 10. The highest number of fire incidents - 27 took place in 2016, and the least - 0 in 2012. The data has an increasing trend.
The average number of yearly fire incidents per 10k residents in Bayonet Point, FL compared to nearest cities:
(Note: Based on data for the last 3 years, including only cities with population 5,000 and above)
| Bayonet Point: | 9.9 |
| Hudson: | 95.7 |
| New Port Richey: | 151.1 |
| Trinity: | 3.7 |
| Shady Hills: | 5.6 |
| Holiday: | 35.6 |
| Odessa: | 19.3 |
| Tarpon Springs: | 50.2 |
| Spring Hill: | 8.1 |

 Based on the reports from the years 2002 - 2018 the average number of fire-related yearly casualties is 0. The highest number of injuries - 5 took place in 2015, and the lowest - 0 in 2002. The data has a growing trend.
 31.8% incidents where reported in the morning and 68.2% in the evening. The most fires (21.8%) took place on Saturday, and the least (6.5%) on Thursday.
 Based on the 170 incident reports from years 2002 - 2018 most fires (12.9%) took place during June, and the least (4.1%) in September.
 Out of all 13,509 cases reported during the years 2002 - 2018, the most belonged to the categories: Rescue & EMS (81.0%), Good Intent Call (7.3%), and Service Call (6.9%).
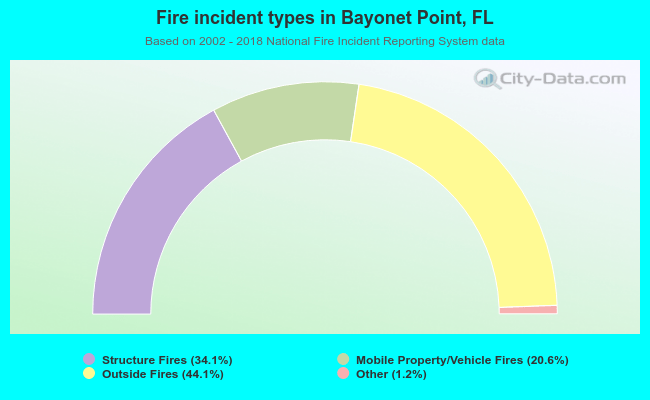 When looking into fire subcategories, the most reports belonged to: Outside Fires (44.1%), and Structure Fires (34.1%).