Pennsauken: Fire Incidents, New Jersey (NJ)
Where are fire incidents reported in Pennsauken, NJ
Something went wrong! Please refresh the page.
| Fire incidents reported | |
|---|---|
| Sreet name | Count |
| ROUTE 130 HWY | 310 |
| RIVER RD | 172 |
| NORTH PARK DR | 138 |
| WESTFIELD AVE | 116 |
| BROWNING RD | 96 |
| HADDONFIELD RD | 94 |
| MAPLE AVE | 78 |
| PARK AVE | 66 |
| ROUTE 70 HWY | 66 |
| UNION AVE | 64 |
| COVE RD | 52 |
| HERBERT AVE | 52 |
| HYLTON RD | 52 |
| LEXINGTON AVE | 52 |
| MARLTON PIKE | 50 |
| 36TH ST | 48 |
| 45TH ST | 46 |
| MERCHANTVILLE AVE | 46 |
| ZIMMERMAN AVE | 46 |
| 47TH ST | 44 |
| CENTRAL HWY | 44 |
| ROUTE 130 | 44 |
| ROUTE 73 HWY | 44 |
| 46TH ST | 42 |
| ROUTE 38 HWY | 42 |
| 48TH ST | 40 |
| WEST RIVER DR | 38 |
| HIGH ST | 36 |
| DEROUSSE AVE | 34 |
| 43RD ST | 32 |
| Other | 26 |
2003 - 2018 National Fire Incident Reporting System (NFIRS) incidents
- Incident types reported to NFIRS in Pennsauken, NJ
- 2,75225.6%Hazardous Condition
- 2,11019.6%Fire
- 2,05519.1%Rescue & EMS
- 1,86017.3%False Alarm
- 9649.0%Good Intent Call
- 9358.7%Service Call
- 330.3%Severe Weather
- 170.2%Special Incident
- 150.1%Overpressure Rupture
- Fire incident types reported to NFIRS in Pennsauken, NJ
- 1,05550.0%Structure Fires
- 72334.3%Outside Fires
- 32015.2%Mobile Property/Vehicle Fires
- 120.6%Other
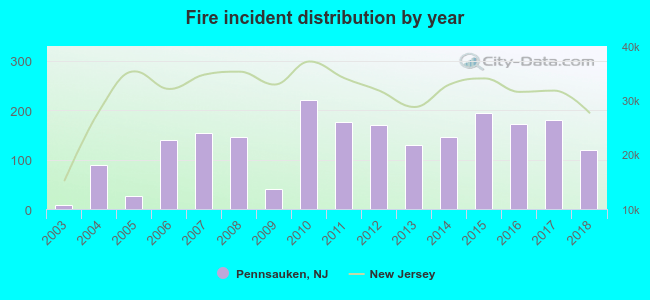 According to the data from the years 2003 - 2018 the average number of fire incidents per year is 132. The highest number of fire incidents - 220 took place in 2010, and the least - 9 in 2003. The data has an increasing trend.
The average number of yearly fire incidents per 10k residents in Pennsauken, NJ compared to nearest cities:
(Note: Based on data for the last 3 years, including only cities with population 5,000 and above)
| Pennsauken: | 43.1 |
| Collingswood: | 84.3 |
| Camden: | 55.5 |
| Palmyra: | 35.0 |
| Haddonfield: | 26.9 |
| Audubon: | 35.6 |
| Haddon Heights: | 29.4 |
| Gloucester City: | 52.7 |
| Barrington: | 61.0 |
 The median response time based on all reported fire incidents is 5 minutes. This is about the same as the state median value.
The median response time in Pennsauken, NJ compared to nearest cities:
(Note: Based on data for all years, including only cities with at least 500 fire incidents)
| Pennsauken: | 5 minutes |
| Collingswood: | 4 minutes |
| Camden: | 4 minutes |
| Palmyra: | 4 minutes |
| Haddonfield: | 6 minutes |
| Audubon: | 5 minutes |
| Haddon Heights: | 6 minutes |
| Gloucester City: | 4 minutes |
| Barrington: | 7 minutes |
 Based on the data from the years 2003 - 2018 the average number of fire-related casualties per year is 1. The highest number of casualties - 6 took place in 2011, and the lowest - 0 in 2003. The data has a constant trend.
The average number of injuries per 1,000 fires is 7. This indicator was the highest - 34 in 2011, and the lowest 0 in 2003. The trend for injuries per 1,000 incidents is constant. Compared to the state value the number of injuries per 1,000 fires is about the same.
Based on the data from the years 2003 - 2018 the average number of fire-related casualties per year is 1. The highest number of casualties - 6 took place in 2011, and the lowest - 0 in 2003. The data has a constant trend.
The average number of injuries per 1,000 fires is 7. This indicator was the highest - 34 in 2011, and the lowest 0 in 2003. The trend for injuries per 1,000 incidents is constant. Compared to the state value the number of injuries per 1,000 fires is about the same.Casualties per 1,000 incidents in Pennsauken, NJ compared to nearest cities:
(Note: Based on data for all years, including only cities with at least 500 fire incidents)
| Pennsauken: | 9.0 |
| Collingswood: | 13.0 |
| Camden: | 17.0 |
| Palmyra: | 1.7 |
| Haddonfield: | 1.4 |
| Audubon: | 6.2 |
| Haddon Heights: | 3.8 |
| Gloucester City: | 7.4 |
| Barrington: | 0.0 |
 29.3% incidents where reported in the morning and 70.7% in the evening. The most fires (15.7%) took place on Wednesday, and the least (12.9%) on Tuesday.
 According to the 2,110 fires from years 2003 - 2018 most fires (11.2%) took place during March, and the least (6.2%) in February.
 Out of all 10,741 cases reported during the years 2003 - 2018, the most belonged to the categories: Hazardous Condition (25.6%), Fire (19.6%), and Rescue & EMS (19.1%).
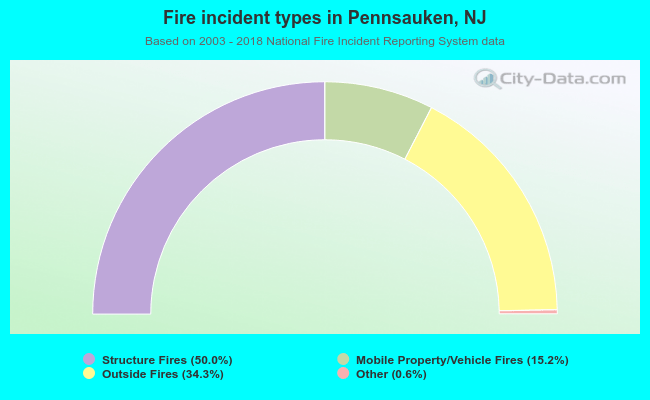 When looking into fire subcategories, the most reports belonged to: Structure Fires (50.0%), and Outside Fires (34.3%).