Haddonfield: Fire Incidents, New Jersey (NJ)
Where are fire incidents reported in Haddonfield, NJ
Something went wrong! Please refresh the page.
| Fire incidents reported | |
|---|---|
| Sreet name | Count |
| KINGS HWY | 158 |
| KINGS | 68 |
| CENTRE ST | 42 |
| HADDON AVE | 40 |
| LINCOLN AVE | 28 |
| LAKE ST | 22 |
| MAPLE AVE | 20 |
| TANNER ST | 20 |
| WALNUT ST | 20 |
| WAYNE AVE | 20 |
| EDGE PARK DR | 18 |
| HADDON | 18 |
| HOPKINS LANE | 18 |
| POTTER ST | 18 |
| WARWICK RD | 18 |
| ATLANTIC AVE | 16 |
| BEECHWOOD AVE | 16 |
| CHEWS LANDING RD | 16 |
| HOPKINS | 16 |
| LINDEN | 16 |
| PROSPECT RD | 16 |
| CHESTNUT ST | 14 |
| COTTAGE AVE | 14 |
| ELLIS ST | 14 |
| GROVE ST | 14 |
| LINDEN AVE | 14 |
| ROBERTS AVE | 14 |
| CEDAR AVE | 12 |
| HAWTHORNE AVE | 12 |
| JEFFERSON AVE | 12 |
2002 - 2018 National Fire Incident Reporting System (NFIRS) incidents
- Incident types reported to NFIRS in Haddonfield, NJ
- 96128.8%Hazardous Condition
- 81724.5%False Alarm
- 73822.1%Fire
- 3019.0%Good Intent Call
- 2748.2%Rescue & EMS
- 1805.4%Service Call
- 521.6%Severe Weather
- 120.4%Overpressure Rupture
- Fire incident types reported to NFIRS in Haddonfield, NJ
- 49767.3%Structure Fires
- 12416.8%Outside Fires
- 9112.3%Other
- 263.5%Mobile Property/Vehicle Fires
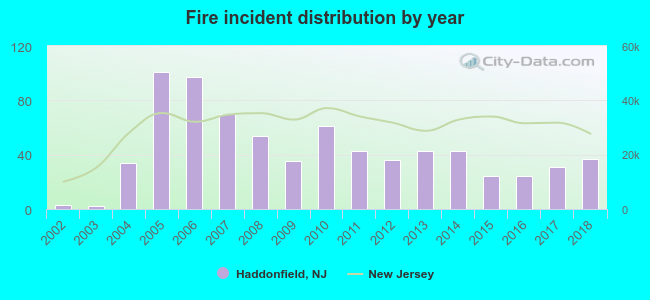 According to the data from the years 2002 - 2018 the average number of fires per year is 43. The highest number of reported fire incidents - 101 took place in 2005, and the least - 2 in 2003. The data has a growing trend.
The average number of yearly fire incidents per 10k residents in Haddonfield, NJ compared to nearest cities:
(Note: Based on data for the last 3 years, including only cities with population 5,000 and above)
| Haddonfield: | 26.9 |
| Audubon: | 35.6 |
| Haddon Heights: | 29.4 |
| Barrington: | 61.0 |
| Collingswood: | 84.3 |
| Bellmawr: | 51.2 |
| Somerdale: | 85.5 |
| Runnemede: | 46.2 |
| Pennsauken: | 43.1 |
 The median response time based on all reported fire incidents is 6 minutes. This is comparable to the state median value.
The median response time in Haddonfield, NJ compared to nearest cities:
(Note: Based on data for all years, including only cities with at least 500 fire incidents)
| Haddonfield: | 6 minutes |
| Audubon: | 5 minutes |
| Haddon Heights: | 6 minutes |
| Barrington: | 7 minutes |
| Collingswood: | 4 minutes |
| Magnolia: | 6 minutes |
| Bellmawr: | 6 minutes |
| Runnemede: | 7 minutes |
| Pennsauken: | 5 minutes |
 29.3% incidents where reported in the morning and 70.7% in the evening. The most fires (18.3%) took place on Friday, and the least (12.9%) on Monday.
 Based on the 738 fire incident reports from years 2002 - 2018 most fires (11.5%) took place during March, and the least (6.1%) in September.
 Out of all 3,338 cases reported during the years 2002 - 2018, the most belonged to the categories: Hazardous Condition (28.8%), False Alarm (24.5%), and Fire (22.1%).
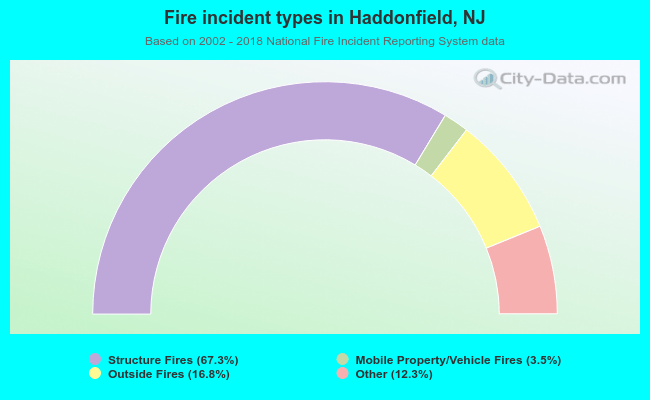 When looking into fire subcategories, the most incidents belonged to: Structure Fires (67.3%), and Outside Fires (16.8%).