Barrington: Fire Incidents, New Jersey (NJ)
Where are fire incidents reported in Barrington, NJ
Something went wrong! Please refresh the page.
|
| |||||||||||||||||||||||||||||||||||||||||||||||||||||||||||||||||||||||||||||||||||||||||||||||||||||||||||||
2003 - 2018 National Fire Incident Reporting System (NFIRS) incidents
- Incident types reported to NFIRS in Barrington, NJ
- 59828.8%Hazardous Condition
- 54626.3%Fire
- 35717.2%Good Intent Call
- 31715.3%False Alarm
- 1386.7%Service Call
- 1055.1%Rescue & EMS
- 80.4%Overpressure Rupture
- 30.1%Severe Weather
- Fire incident types reported to NFIRS in Barrington, NJ
- 41576.0%Structure Fires
- 6411.7%Outside Fires
- 458.2%Mobile Property/Vehicle Fires
- 224.0%Other
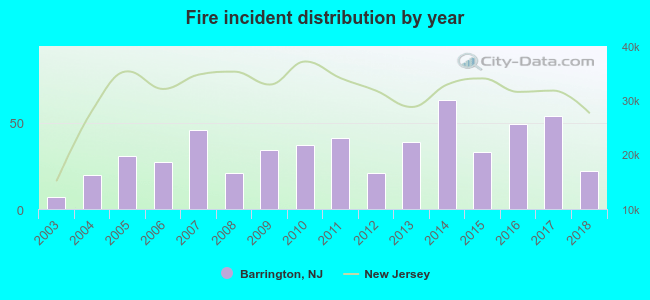 According to the data from the years 2003 - 2018 the average number of fires per year is 34. The highest number of reported fires - 63 took place in 2014, and the least - 7 in 2003. The data has a rising trend.
The average number of yearly fire incidents per 10k residents in Barrington, NJ compared to nearest cities:
(Note: Based on data for the last 3 years, including only cities with population 5,000 and above)
| Barrington: | 61.0 |
| Haddon Heights: | 29.4 |
| Audubon: | 35.6 |
| Runnemede: | 46.2 |
| Haddonfield: | 26.9 |
| Bellmawr: | 51.2 |
| Somerdale: | 85.5 |
| Collingswood: | 84.3 |
| Stratford: | 51.4 |
 The median response time based on all reported fire incidents is 7 minutes. This is higher compared to the New Jersey median value.
The median response time in Barrington, NJ compared to nearest cities:
(Note: Based on data for all years, including only cities with at least 500 fire incidents)
| Barrington: | 7 minutes |
| Haddon Heights: | 6 minutes |
| Magnolia: | 6 minutes |
| Audubon: | 5 minutes |
| Runnemede: | 7 minutes |
| Haddonfield: | 6 minutes |
| Bellmawr: | 6 minutes |
| Collingswood: | 4 minutes |
| Gloucester City: | 4 minutes |
 37.4% incidents where reported in the morning and 62.6% in the evening. The most fires (17.4%) took place on Sunday, and the least (11.2%) on Wednesday.
 Based on the 546 incident reports from years 2003 - 2018 most fires (15.0%) took place during May, and the least (4.4%) in August.
 Out of all 2,074 cases reported during the years 2003 - 2018, the most belonged to the categories: Hazardous Condition (28.8%), Fire (26.3%), and Good Intent Call (17.2%).
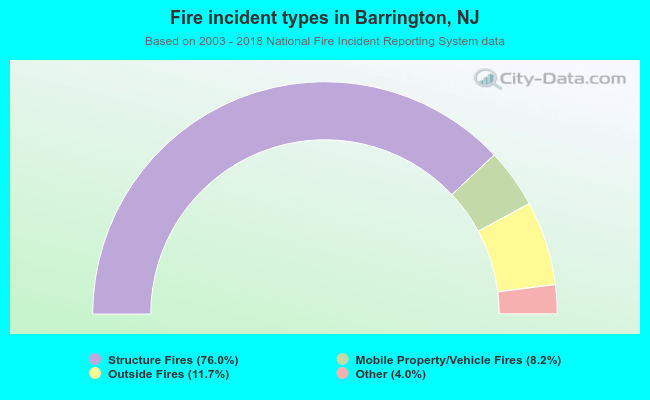 When looking into fire subcategories, the most reports belonged to: Structure Fires (76.0%), and Outside Fires (11.7%).